



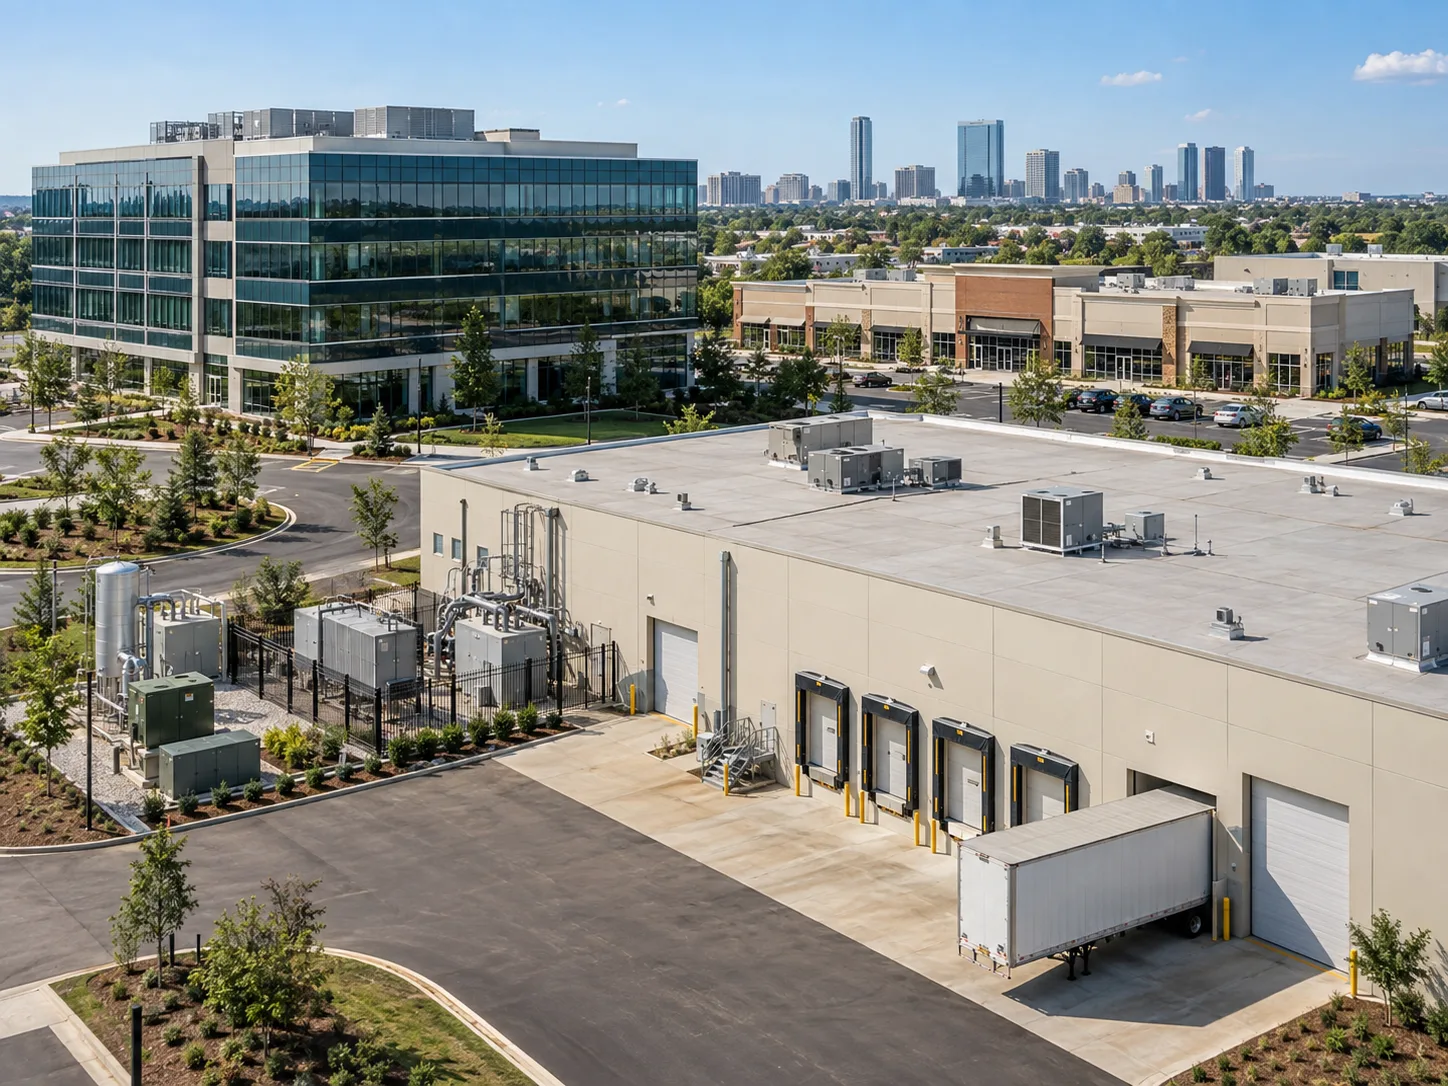
- BOMA estimates commercial building operations generated $609.9B in US economic output from $274.9B of 2025 operating spending.
- The covered 35.4B SF of office, retail, and industrial property supported about 3.85M direct and indirect jobs.
- Recurring property operations create economic activity long after construction ends, with every operating dollar generating about $2.22 of output.
Commercial real estate operations create a large recurring economic footprint, according to BOMA International. The organization’s 2026 Market Study estimates that 2025 building operations supported nearly $610B of US economic output.
Get Smarter about what matters in CRE
Stay ahead of trends in commercial real estate with CRE Daily – the free newsletter delivering everything you need to start your day in just 5-minutes
The Details
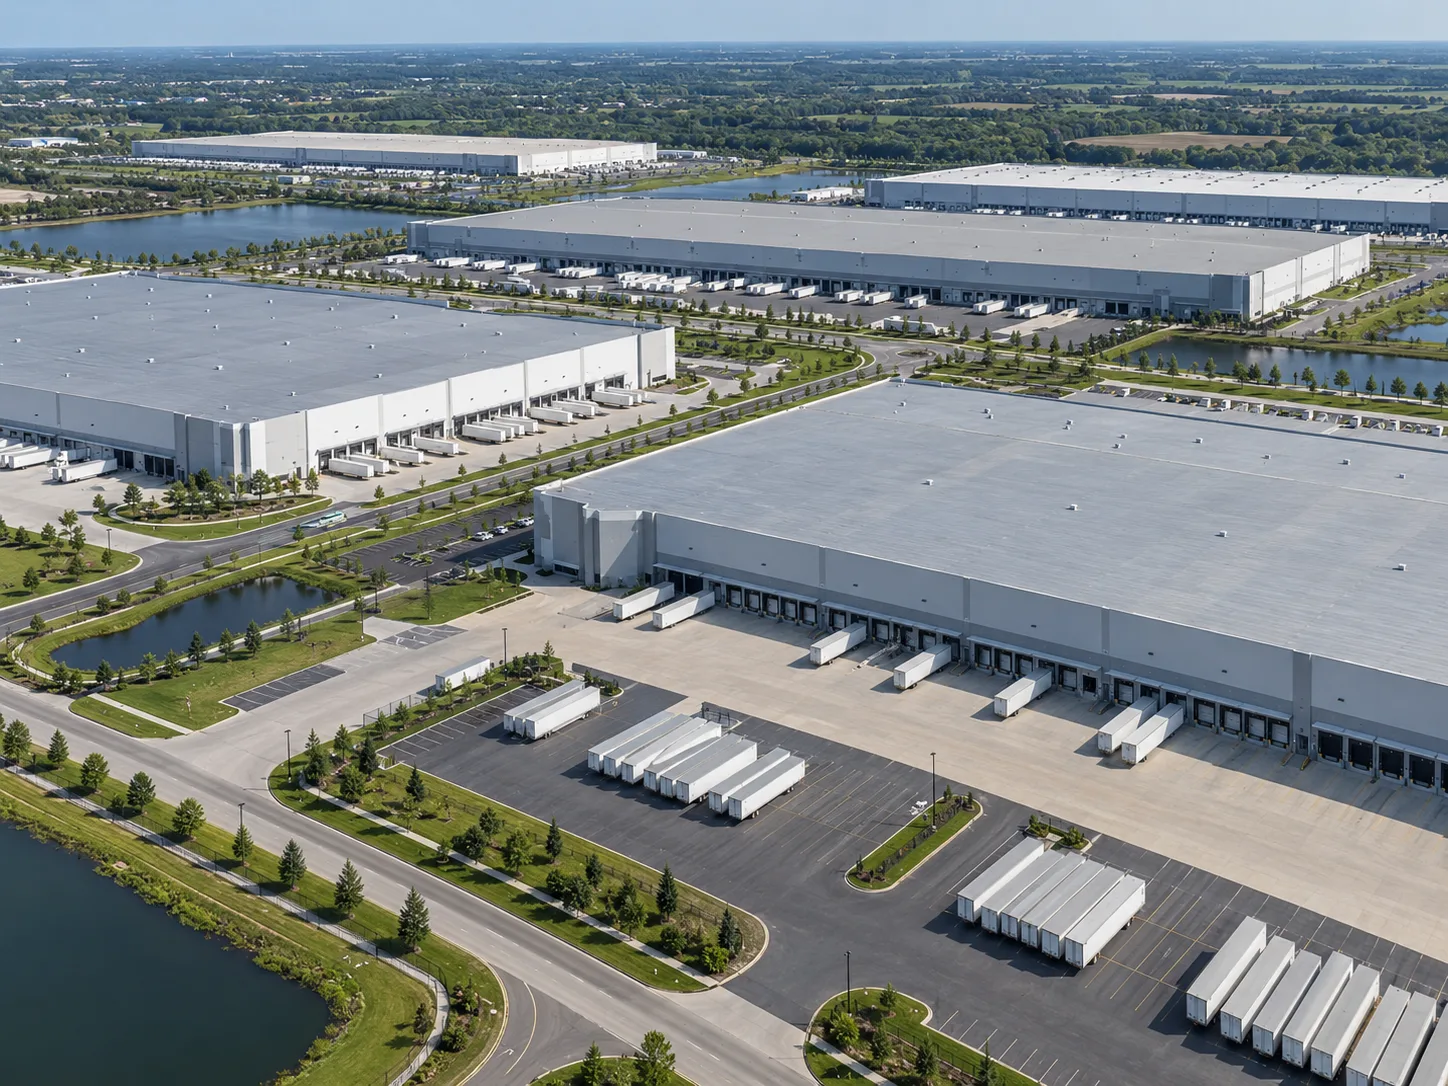
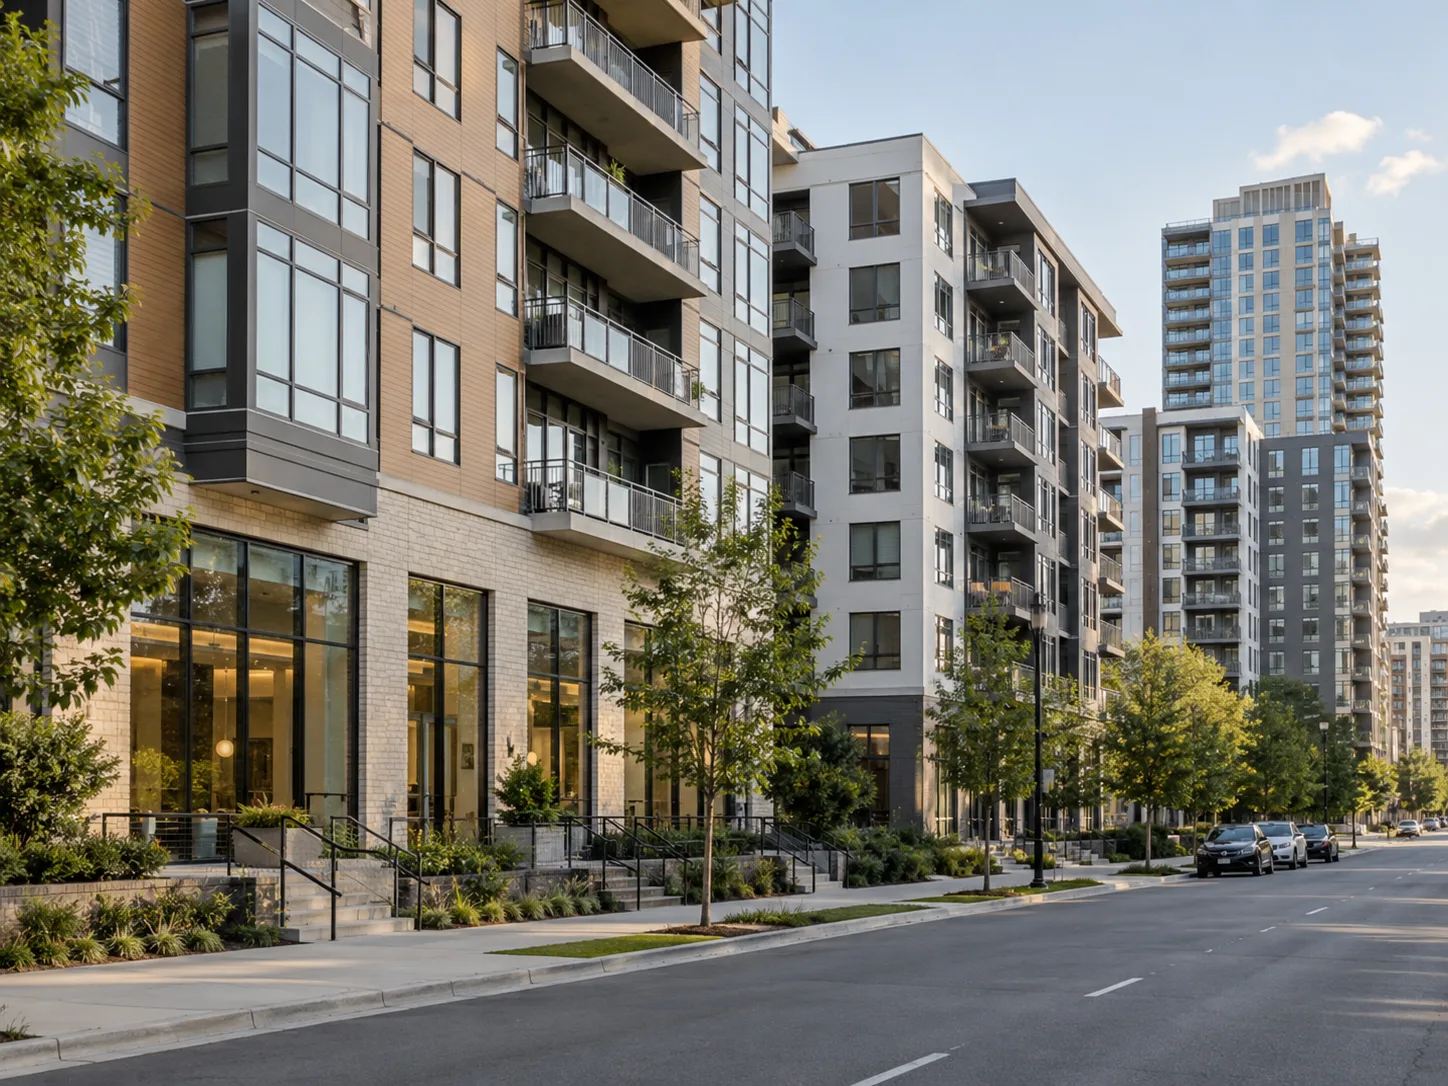
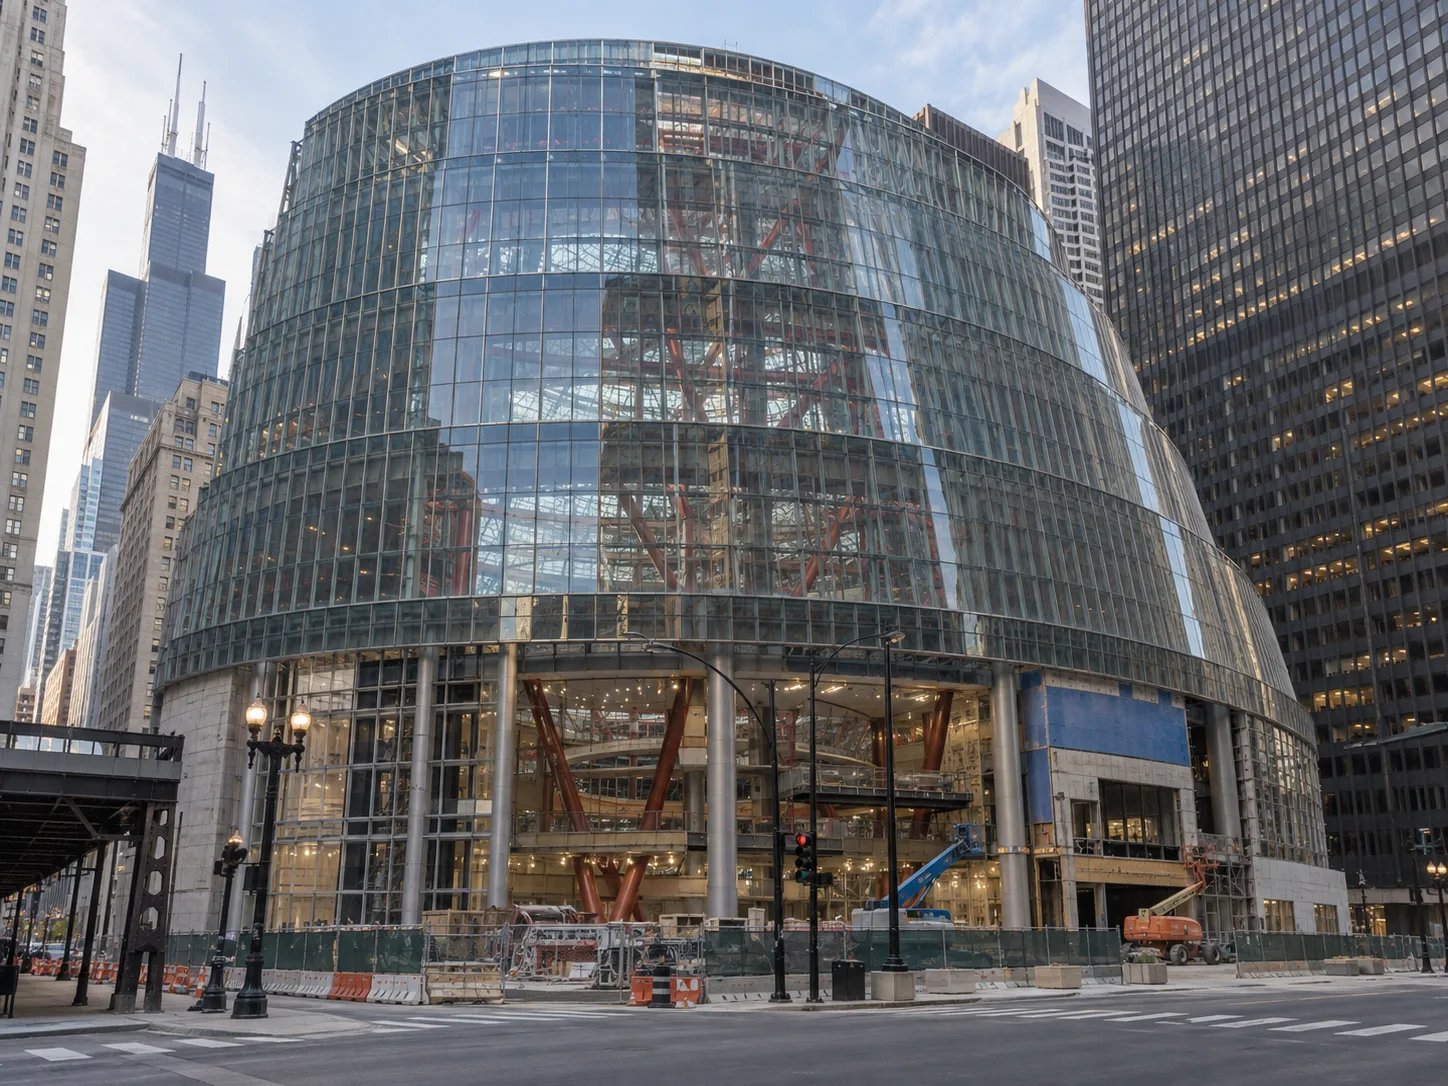
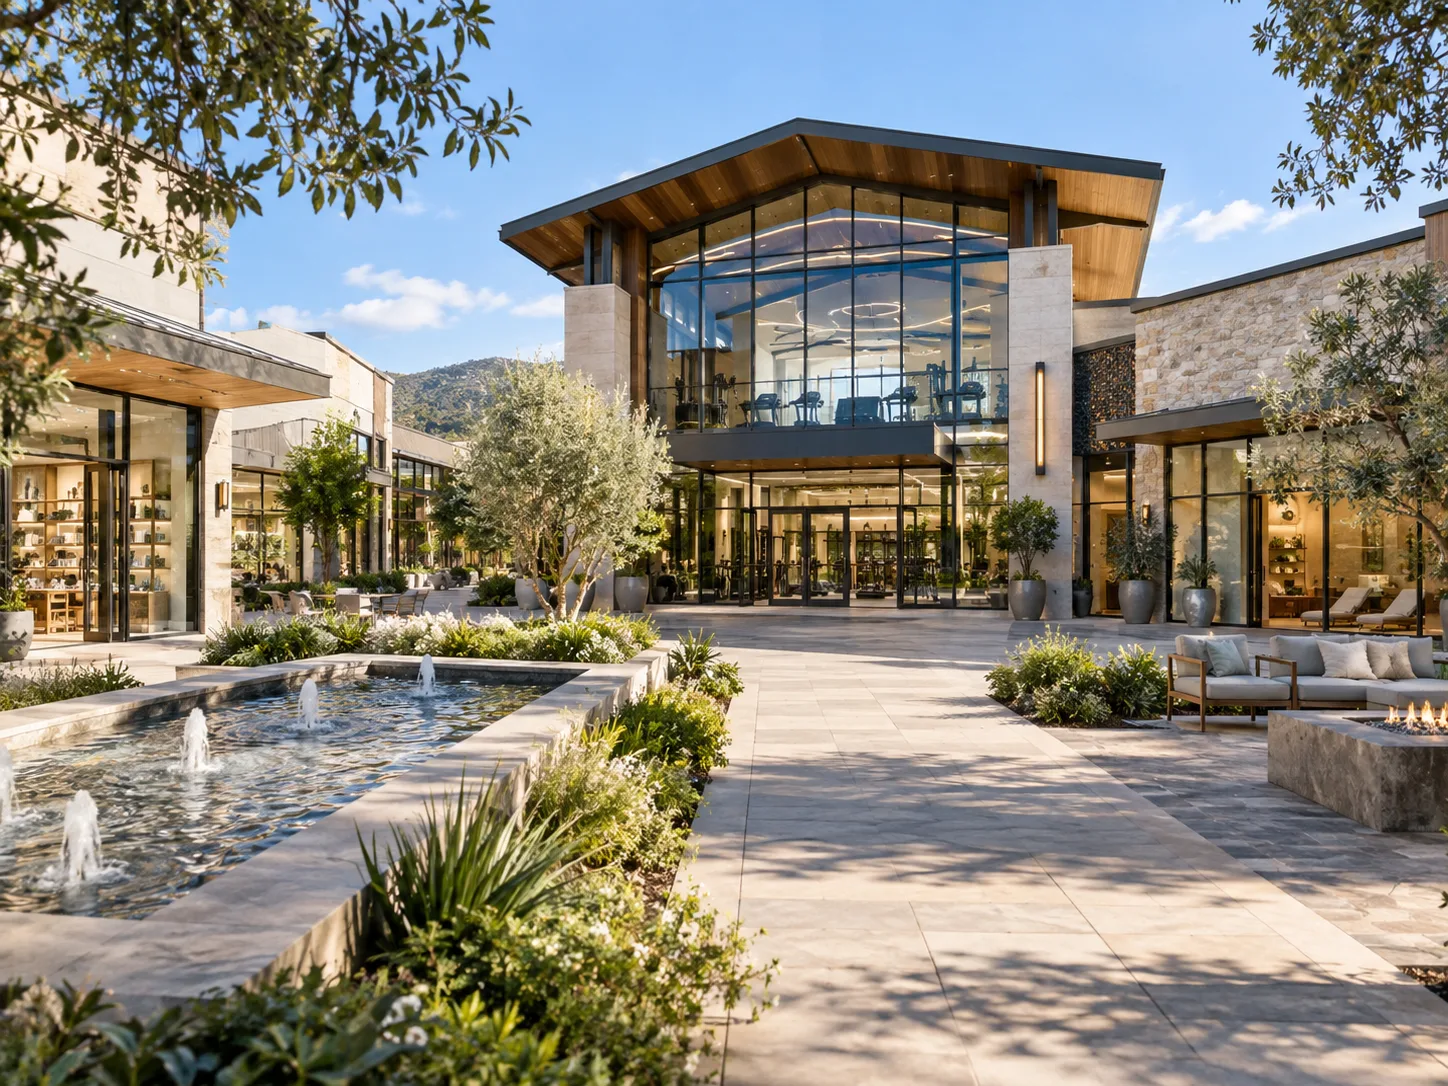
The study covers privately owned office, retail, and industrial buildings of at least 25,000 SF across 79 BOMA local association markets. The covered inventory totals about 35.4B SF.
Using CoStar inventory data and NCREIF operating expenses, the report estimated $274.9B of 2025 operating expenditures. That equals about $7.78 PSF across the covered properties.
BOMA’s economic model links that spending to $609.9B in total output, $344.4B in US GDP, and $219.4B in personal earnings. It also supports about 3.85M jobs.
Roughly 2.43M jobs are directly tied to building expenditures. Another 1.42M jobs come from indirect supply-chain activity and household spending supported by those wages.
The IMPLAN model separates direct building spending from indirect supplier activity and induced household spending. BOMA also applies local data quality controls when operating-cost inputs are limited or unusually volatile.
Operating Spending Multiplies Through the Economy
The report calculated an overall output multiplier of 2.22. That means each dollar spent operating covered commercial buildings produces about $2.22 of total economic activity.
Its GDP multiplier is 2.33, the labor-income multiplier is 2.02, and the employment multiplier is 1.58. Retail posted the highest property-level output multiplier at 2.26.
The mechanism is straightforward. Building owners pay for utilities, insurance, maintenance, cleaning, management, taxes, and repairs, which then support vendors, employees, suppliers, and household spending.
Major Markets Drive the Largest Totals
The 30 largest BOMA markets generated $435.9B in total output and $249.2B in GDP, according to the study. Together they supported about 2.7M jobs.
Greater New York led with about $48B of output. Greater Los Angeles followed at roughly $29.6B, then Boston at $28.4B and Metropolitan Washington at $25.8B.
Suburban Chicago generated about $23.7B. The concentration shows how national operating activity is anchored by major metros even as smaller markets contribute to the total.
Office properties account for the largest employment component at about 1.89M jobs, including 1.20M direct positions. Retail supports about 1.21M jobs, while industrial supports roughly 760,100.
Construction Expands the Future Operating Base
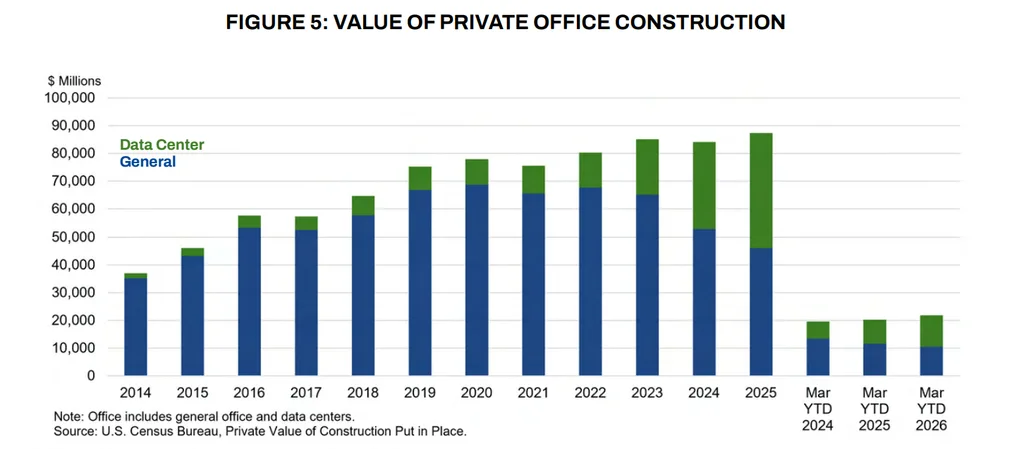
The report separately tracks construction because completed properties become future operating inventory. Office-category construction exceeded $90B in 2025, but data centers changed the mix sharply.
Data center construction rose from about $1.8B in 2014 to $41.2B in 2025. That represented almost 46% of the office-category construction total.
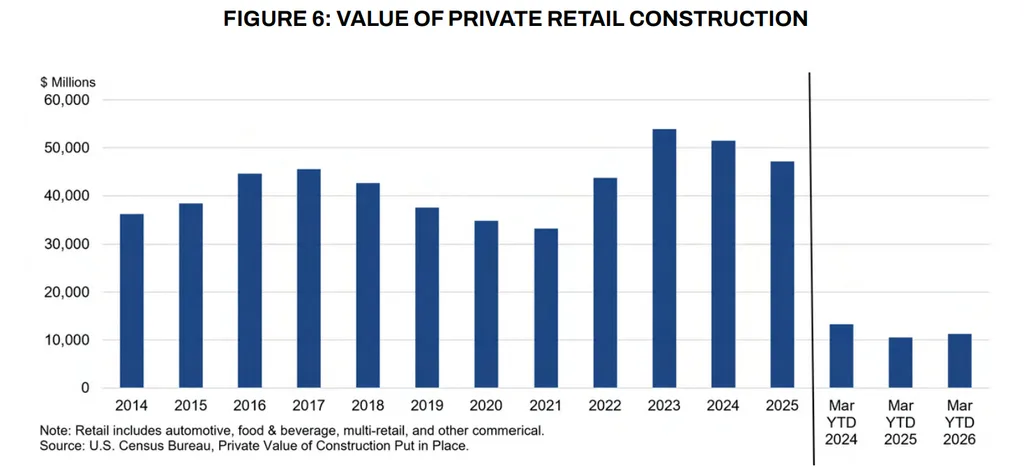
Traditional office construction excluding data centers fell from roughly $71B in 2020 to $48.4B in 2025. Retail construction totaled about $47.1B, while warehouse and manufacturing construction reached roughly $274.2B.
Why It Matters
The study treats operating expenses as a recurring economic engine throughout a property’s life. Unlike construction spending, those costs repeat as long as buildings remain in service.
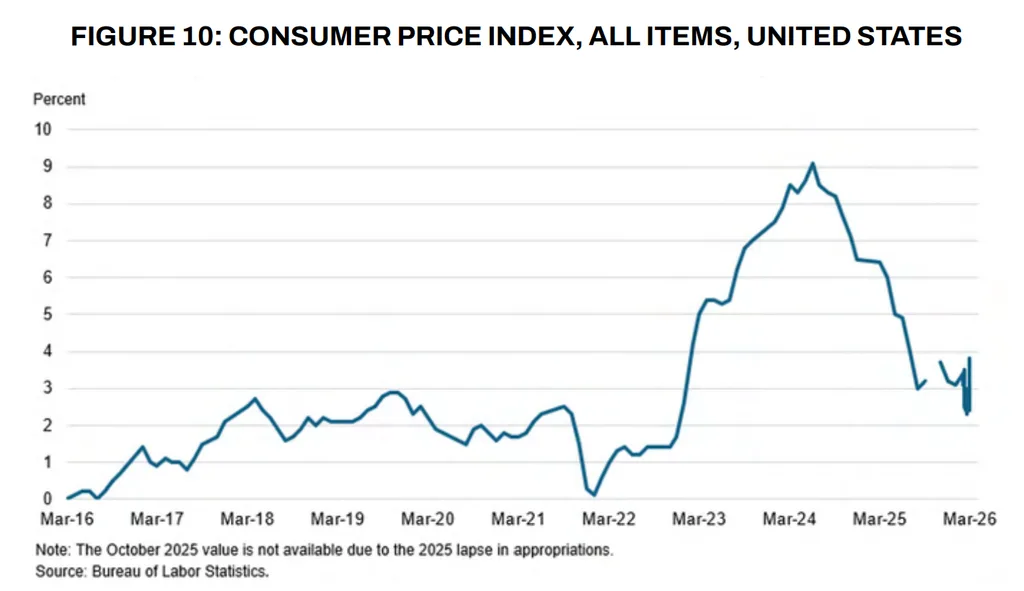
The operating environment is also more expensive than during the 2010s. The report says elevated rates plus higher labor, energy, insurance, and other costs continue to pressure property income.
Still, sector conditions showed areas of stabilization entering 2026. Office vacancy fell to 18.6% in Q1, retail availability was 4.9%, and industrial vacancy held at 6.7%.
Office fundamentals showed early stabilization as Q1 leasing reached 56.2M SF, the strongest first quarter in four years. Net absorption remained positive for an eighth straight quarter.
Retail asking rents rose 2.4% year over year to $24.59 PSF. Industrial Q1 absorption totaled 43.1M SF, and 23 leases exceeded 1M SF.
What’s Next
BOMA’s conclusion is that recurring economic impact expands with the professionally managed CRE inventory. New construction therefore matters twice, first during development and later through years of operating spending.
The study also shows that future gains will depend on property fundamentals and operating costs. Those factors determine how efficiently the growing inventory can support jobs, vendors, and local economic activity.
Life sciences adds another, separately measured operating base. In 17 markets, $1.8B of operating spending generated $3.7B of output and supported 22,357 jobs outside the main totals.