




- Median office expense growth beat revenue growth in every year from 2021 through 2025 in Trepp’s CMBS property sample.
- The implied annualized growth rate was 2.7% for operating expenses, 1.3% for revenue and just 0.2% for NOI.
- Property insurance had the fastest implied annualized expense growth at 6.1%. Median NOI was negative in both 2024 and 2025.
Trepp’s analysis of office properties backing CMBS loans found expenses growing faster than revenue in every year from 2021 through 2025. The five annual medians produced 2.7% implied annualized expense growth. Revenue grew 1.3%, while NOI grew just 0.2%.
Get Smarter about what matters in CRE
Stay ahead of trends in commercial real estate with CRE Daily – the free newsletter delivering everything you need to start your day in just 5-minutes
The Details
Median operating expense growth eased to 2.1% in 2025 from 2.5% in 2024. Revenue growth also slowed, falling to 0.7% from 1.1%. That left a 1.4-percentage-point gap between expenses and revenue for the second consecutive year. Median NOI growth was negative 0.4%, its second straight annual decline. The reporting sample also shrank over the period, from 3,599 properties in 2021 to 2,266 in 2025. The annual gap was widest in 2022 at 2.3 percentage points. It narrowed to 0.3 points in 2023, then reopened to 1.4 points in both 2024 and 2025. Median NOI growth was negative in 2021, 2024 and 2025.
Insurance and Utilities Lead the Pressure
Property insurance recorded the fastest implied annualized growth among reported expense lines at 6.1%. Utilities followed at 4.9%. Payroll and benefits grew 3.3%, repairs and maintenance 3.2%, and general and administrative costs 2.7%. Real estate taxes grew 1.1%, below the 1.3% revenue rate. In 2025, insurance growth slowed sharply to 3.3% from 5.8%.
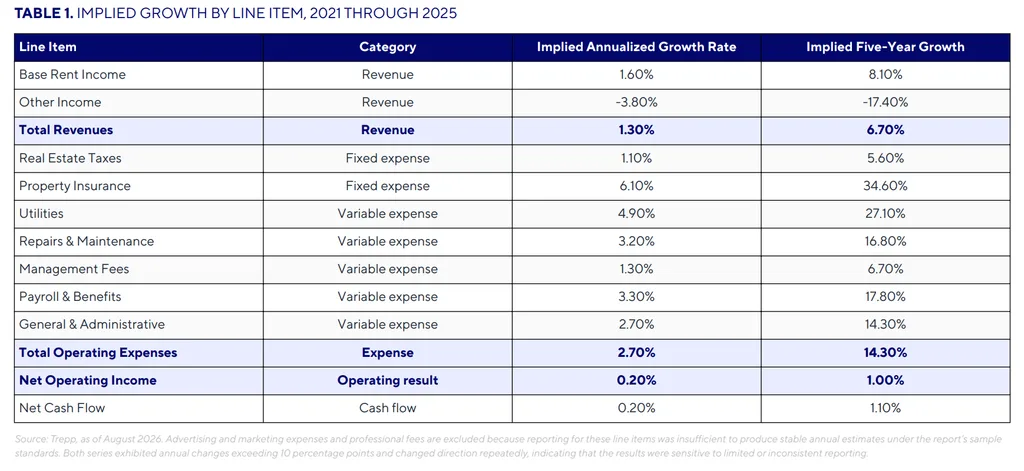
Utilities moved the other way, accelerating to 6.7% from 2.0%. Base rent income posted 1.6% implied annualized growth, while other income declined 3.8%. Management fees were the exception among variable expenses. Management fees grew 1.3%, matching total revenue growth to the first decimal. Trepp called that a useful reasonableness check because fees often track effective gross income.
Refinancing Capacity Gains Little Support
Trepp said the cash-flow pattern offered limited additional refinancing support. Chaining annual net cash flow medians produced an implied five-year increase of only 1.1%. Trepp illustrated the effect with an interest-only loan at an 8.00% debt yield. The same cash-flow increase would lift it only to about 8.09%. Trepp stressed that the example is not an observed median loan.
Even so, the analysis shows why office expense pressure matters in refinancing. Lenders also evaluate leverage, coverage, rates, amortization and proceeds tests. Other refinancing constraints can include loan-to-value ratios, debt-service coverage, interest rates, amortization requirements and lender proceeds tests.
Regional and Market Results Diverge
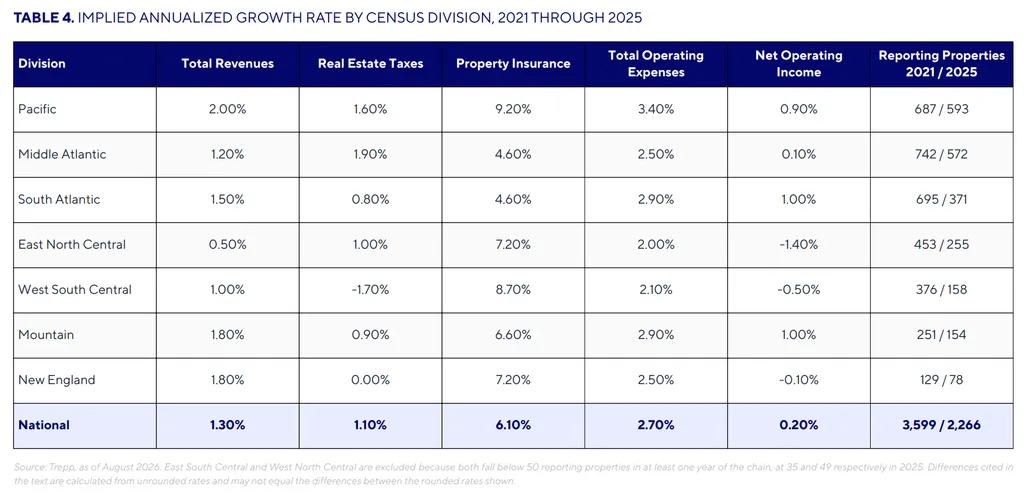
Operating expenses outgrew revenue in all seven Census divisions that met Trepp’s sample threshold. The gap ranged from 0.8 percentage points in New England to 1.6 points in East North Central. Among the largest office markets, Los Angeles led with 2.5% implied annualized revenue growth and 1.3% NOI growth. Chicago was the weakest, with revenue down 0.7% and NOI down 1.9%. New York recorded 1.0% revenue growth but negative 0.6% NOI growth. Across the five largest markets combined, expenses grew 2.9% against 1.3% revenue, with NOI down 0.1%.
Why It Matters
The report shows that slower expense growth alone has not restored office cash-flow growth. Property insurance remains the most persistent cost pressure, while the 2025 jump in utilities added another headwind. Meanwhile, revenue growth slowed enough to keep the expense gap open. That leaves refinancing outcomes more dependent on each property’s actual performance, leverage and loan structure. The national medians also hide meaningful regional differences. Some markets grew revenue, while others saw both revenue and NOI weaken.
What’s Next
Trepp’s outlook is cautious rather than directional. The 2025 moderation in operating expenses did not lift median NOI, and net cash flow growth remained modest. Future refinancing capacity will therefore depend on whether properties can produce stronger revenue gains or sustain slower cost growth. Trepp also cautioned that the annual eligible sample changes over time.
The implied growth rates are not a fixed-cohort performance series. Loan-level underwriting remains necessary to translate these trends into actual refinancing capacity. The report also notes that the analysis measures growth rates rather than dollar amounts. It cannot identify a typical cost per SF or replace property-level underwriting.