




- CMBS office market performance is increasingly bifurcated by asset quality, market, and capital access.
- Top-tier CBD assets maintain occupancy and attract refinancing, while weaker buildings see rising distress and higher delinquency.
- This growing divergence is changing how capital flows and may reshape refinancing options across the US office sector.
Capital’s Sorting Mechanism Intensifies in Office Sector
The US office sector’s divide between winners and losers sharpened through 2026, per Trepp CMBS data. Institutional capital is clustering around high-quality, well-leased assets, while a growing class of buildings slip into distress or obsolescence. At the Trepp Connect conference in New York, RXR’s Scott Rechler highlighted the firm’s internal “Project Kodak” framework, which categorizes assets as having durable value or falling behind in a rapidly evolving market.
The CMBS office universe now moves in two speeds: properties in top locations with strong tenants still draw both debt and leasing demand, while legacy assets in softer submarkets struggle to stabilize. Occupancy, capital allocation, and refinancing activity all reinforce this market bifurcation, dividing the office sector between the financeable and the functionally obsolete.
Get Smarter about what matters in CRE
Stay ahead of trends in commercial real estate with CRE Daily – the free newsletter delivering everything you need to start your day in just 5-minutes
The End of a Singular Office Market
The data shows a market where location and asset quality matter more than ever. Trepp’s CMBS tracking shows strong occupancy and lower delinquencies in New York, Boston, and Miami. Meanwhile, Denver, Philadelphia, and Atlanta face weaker occupancy and rising delinquencies.
This gap shows that tenant demand and lender interest now concentrate in fewer office markets. Capital increasingly favors large, liquid markets with stronger fundamentals.
The divide also exists within cities. Primary CBDs remain more resilient, while secondary CBDs face higher distress rates. Suburban office markets deliver mixed results, with older locations under the most pressure.
These shifts have created localized capital deserts. The market has moved far from the era of broad office lending across all asset types.
The Details
Recent loan performance highlights the widening gap in refinancing outcomes and value preservation.
Manhattan’s 9 West 57th Street recently secured a $1.8B SASB loan at 92% occupancy. Blue-chip tenants, including Apollo and Chanel, support the property. The building carries a 1.73x DSCR and a 51.8% loan-to-value ratio. Its implied cap rate sits at 4.5%, highlighting strong lender demand for prime assets.
By contrast, Bank of America Plaza in St. Louis moved into REO status after losing its anchor tenant. Occupancy fell to 40%. Its appraised value dropped from $72.5M at securitization to $6.4M at its latest review.
SASB executions now dominate office CMBS lending. These deals favor large, institutionally owned, and well-leased CBD assets. Meanwhile, conduit lending continues to retreat amid rising distress and asset uncertainty.
As a result, capital flows increasingly widen the gap between durable and distressed office properties.
CMBS Capital Realigns With Market Fundamentals
Office CMBS issuance has rebounded from 2023 lows, but investor preferences have changed. Issuance has shifted away from conduit deals and toward SASB transactions, reflecting a more selective risk approach.
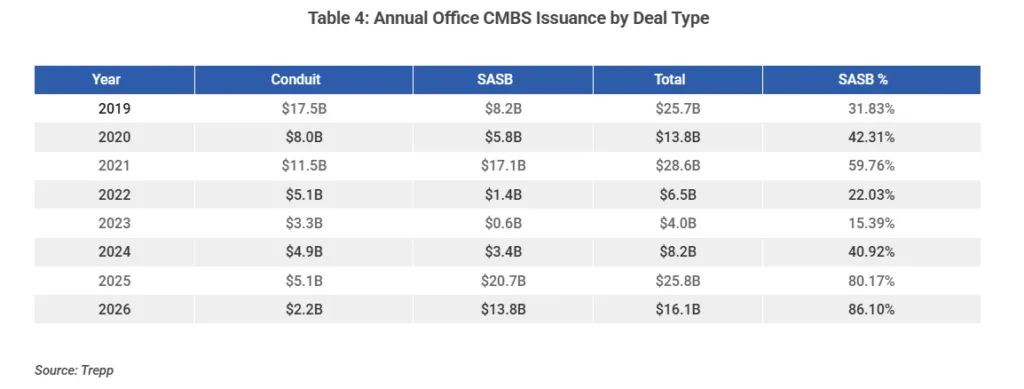
Assets with strong occupancy and credit tenants continue to attract liquidity. Most of that capital targets institutional-scale properties. Meanwhile, buildings facing tenant losses or uncertain cash flows enter special servicing or suffer value declines.
The trend appears across markets and individual assets. Capital increasingly favors buildings aligned with the digital economy, including RXR’s “Project Kodak.” Older properties that fail to meet tenant needs continue losing support. The pattern echoes broader market trends, where recoveries increasingly favor stronger assets while weaker segments continue to lag.
As a result, owners of prime office assets gain pricing power and financing stability. Meanwhile, weaker landlords face fewer refinancing options and continued valuation pressure.
Why It Matters
RXR’s Rechler describes this divide as “Project Kodak,” and it continues reshaping the office market.
Trepp data shows that top office markets with strong tenant rosters maintained occupancy between 85% and 92% through June 2026. Delinquency rates in those markets stayed below 5%.
By comparison, weaker markets reported delinquencies above 10%. Some secondary CBDs posted even higher rates.
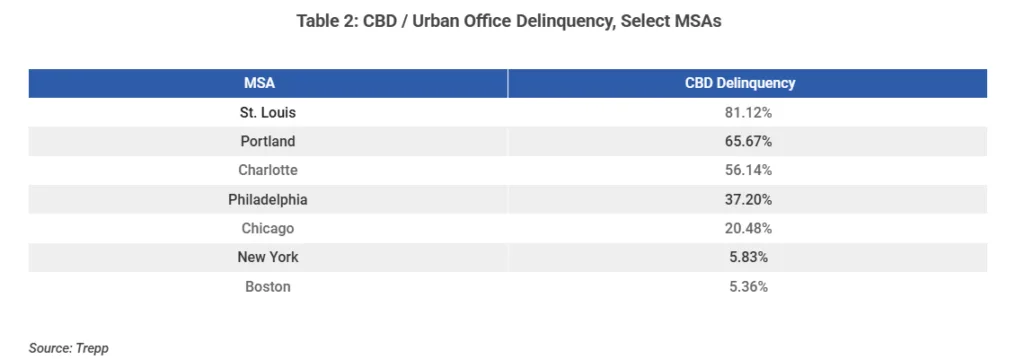
As capital becomes more selective, lower-tier office assets face rising special servicing activity and REO resolutions. Those pressures increase potential losses for lenders and sponsors.
Capital markets now act as a sorting mechanism. They direct refinancing toward assets that attract tenants and preserve value.
Buildings that fail to restore occupancy or secure major tenants continue falling behind. Many experience rapid value erosion, as seen at St. Louis’ Bank of America Plaza.
The office market no longer operates as a single asset class. Instead, outcomes depend on market depth, location, and tenant quality.
Investors, lenders, and service providers must adjust their strategies. Success increasingly depends on micro-market analysis and asset selection.
What’s Next
The divide in office CMBS performance will likely widen further.
High-quality assets in leading markets should continue securing favorable financing terms. Meanwhile, distress and special servicing will likely rise for legacy and lower-tier properties.
Market participants should expect these capital flows to reshape refinancing activity, risk appetite, and asset pricing through the rest of 2026 and beyond.
Investors should also watch for greater divergence in capital markets execution. Tenant durability, asset quality, and local demand fundamentals will play a larger role in office transactions across the US.