


- Wages for US renters have climbed faster than rent and inflation since 2020, per NMHC Research Notes.
- Recent cost-burden data does not yet show improved affordability, partly because of lags in official rent statistics.
- Persistent housing undersupply means affordability pressure remains, but new supply and wage gains are starting to narrow the gap.
Supply Surge Changes the Affordability Narrative
For much of the past decade, US housing demand far outstripped new supply—pushing rent burdens to record highs, according to NMHC Research Notes. The pandemic brought a surge in new apartment construction, peaking post-2020 and slowing rent increases despite still-elevated costs. The Affordable Housing Center at Harvard’s Joint Center for Housing Studies reported that 49% of renters spent over 30% of their income on rent in 2024, capping off a steady rise since 2001. Despite this, a new trend is emerging: wage growth is now outpacing both inflation and rents, a reversal from the post-crisis norm driven by both labor market gains and a flood of new deliveries starting to chip away at structural shortages.
Get Smarter about what matters in CRE
Stay ahead of trends in commercial real estate with CRE Daily – the free newsletter delivering everything you need to start your day in just 5-minutes
The Details
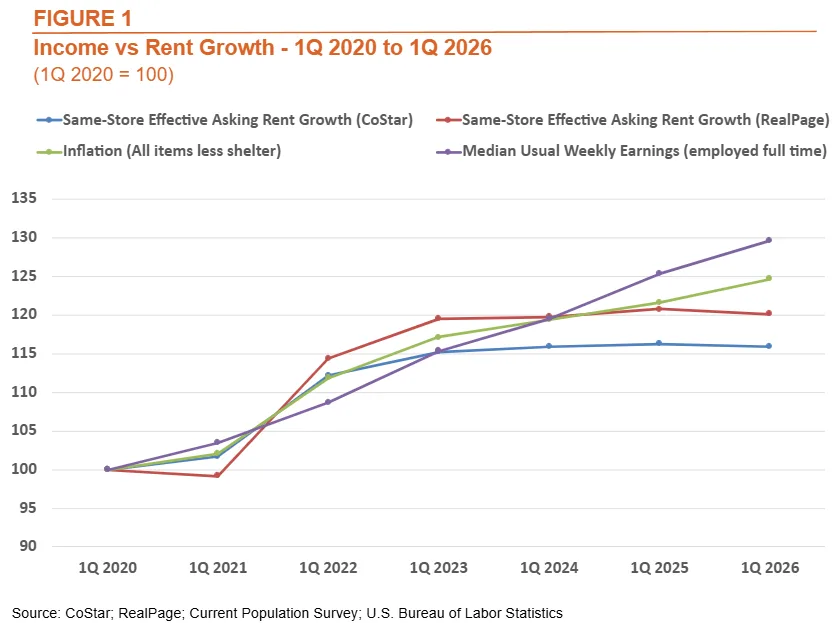
From Q1 2020 to Q1 2026, median weekly wages for full-time US workers rose 4.4% annually, per the Current Population Survey. Lower-income earners saw even stronger gains—up 4.7% per year for the bottom quartile—while high-income workers lagged at 2.7%. Meanwhile, effective asking rents for same-store apartments barely budged, averaging just 0.2% annual growth from Q1 2023 to Q1 2026 (CoStar, RealPage). Even when including pandemic-era spikes, average annual rent growth since 2020 has stayed in the 2.5%–3.1% band, below the 4.0% annual inflation rate. Austin led US metros, with wages jumping 40.7% and rents dropping 3.0% between Q4 2019 and Q4 2025. Major coastal markets like San Jose, Seattle, Denver, and San Francisco also saw wage growth beat rents by wide margins.
Official Affordability Stats Lag Market Shifts
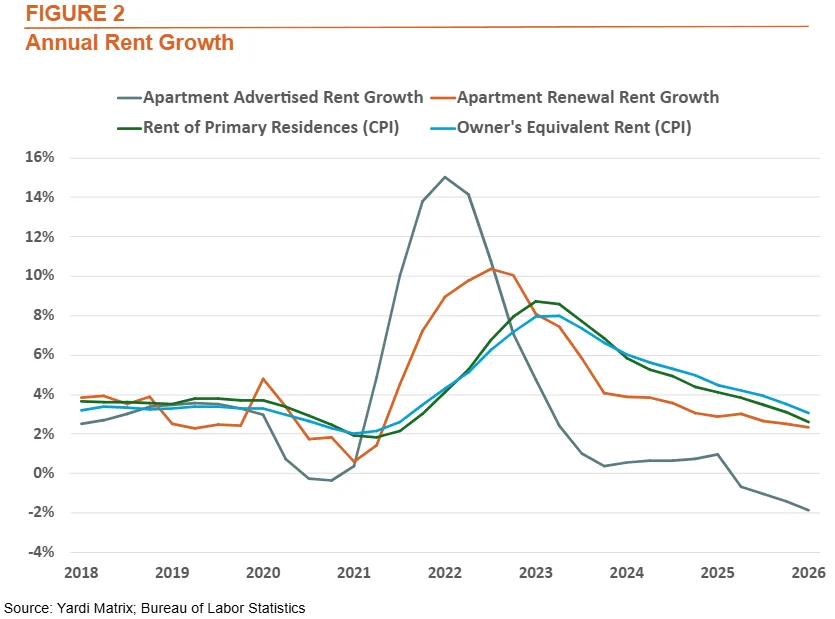
Many property owners and residents are left scratching their heads as government measures still reflect record-high renter burdens. The disconnect is a matter of timing: official stats, such as those in the American Community Survey, capture rents actually paid—including many leases signed years prior. As new supply flattened asking rents, these gains have yet to ripple through to lease renewals or average rents-in-place. Stagnant or falling rents will take time to show up in national cost-burden metrics, especially as retention rates rise and tenants stay put longer.
Notably, household employment remains a key factor: in 2024, apartment households without a full-time worker were 1.87 times more likely to face cost burdens, and 3.67 times more likely to face severe cost burdens than those with at least one full-time adult, underscoring the nuanced relationship between wage growth and affordability.
Why It Matters
Rising supply, slower rents, and lingering affordability strains show how slowly official data adjusts. For the first time in years, wages outpaced rents and inflation. Yet nearly half of renters remained cost-burdened in 2024, up 3.1 points since 2019.
This lag matters for policymakers, lenders, and investors. Better market conditions will not improve burden metrics until leases reset. Wage gains also help, but post-GFC housing shortages still limit progress. Meanwhile, non-housing inflation rose 4.7% from May 2025 to May 2026, squeezing household budgets.
Austin and San Jose highlight the impact of new supply and stronger wages. Employers, developers, and local leaders can identify where affordability improves fastest. Investors may also spot opportunities before official data reflects changing demand and pricing trends.
What’s Next
If construction stays strong and employment holds, cost burdens should ease through 2026. More leases will reset at competitive rates. Recent market signals also suggest improving conditions could support stronger apartment demand next year. Analysts expect affordability data to better reflect market conditions by late 2026 or early 2027. Still, supply gaps will likely keep improvements gradual. As non-housing costs rise, affordability discussions may shift toward total household expenses.