


- Walker & Dunlop leads Fannie Mae multifamily lending in 2026 YTD, originating $2.18B across 110 loans.
- The top 10 agency lenders captured 78% of all Fannie Mae multifamily volume through mid-May, highlighting a highly concentrated market.
- Refinancing, not acquisitions, is defining this cycle as borrowers manage 2026-2027 loan maturities and replace pricier bridge debt.
Walker & Dunlop Leads Fannie Mae’s 2026 Multifamily Lender Rankings
Walker & Dunlop is out in front for Fannie Mae multifamily originations in 2026 year-to-date, originating $2.18B across 110 loans according to CRED iQ. The firm tops a crowded field dominated by familiar agency lending giants, capturing a clear scale advantage in a concentrated segment. The latest CRED iQ data spans loans issued from January through mid-May, making it the most current snapshot of agency activity available for market watchers.
Get Smarter about what matters in CRE
Stay ahead of trends in commercial real estate with CRE Daily – the free newsletter delivering everything you need to start your day in just 5-minutes
Agency Market Share Remains Concentrated Among Largest Lenders
The analysis of 1,071 multifamily loans totaling $16.5B highlights how tight the Fannie Mae lending ecosystem has become. The ten largest lenders accounted for 78% of all volume through mid-May. Walker & Dunlop’s $2.18B narrowly edged out CBRE Multifamily Capital, which originated $1.88B, while PGIM Real Estate Agency Financing rounded out the top three with $1.56B.
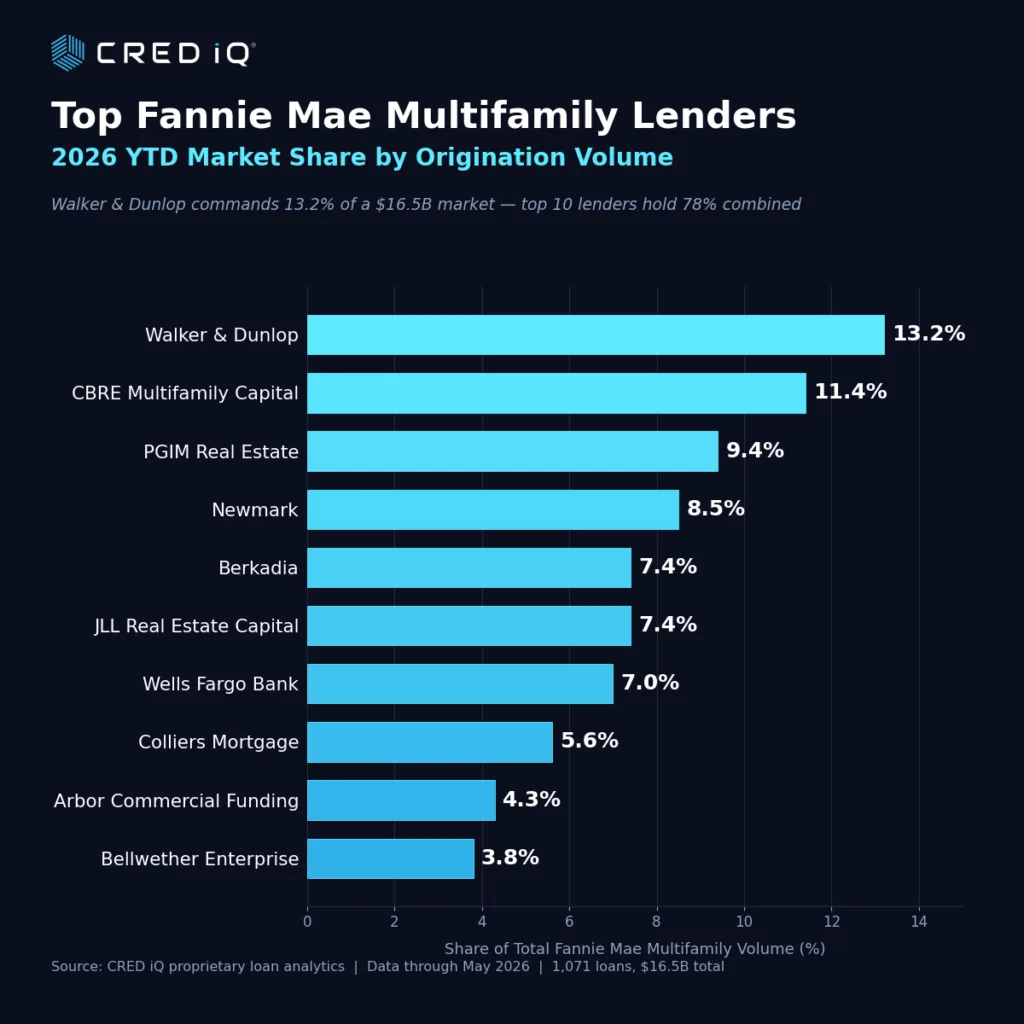
Other top players included Newmark, Berkadia, JLL Real Estate Capital, and major banks like Wells Fargo. Berkadia issued the highest number of individual loans at 172, suggesting a focus on smaller-balance deals, whereas Walker & Dunlop maintained higher average loan balances. With the average loan size at $15.4M, the differences in origination strategy are pronounced.
Refinancing Drives 2026 Fannie Mae Multifamily Volume
Refinance activity drove Fannie Mae multifamily originations in 2026, accounting for nearly 63% of all volume, or $10.3B. Acquisition financing comprised 36.1% ($5.95B), with supplemental loans playing a minor role. The surge in refinance demand comes as property owners look to address maturing debt for 2026 and 2027, and to replace more expensive bridge loans. That refinancing push extends beyond market-rate apartments, with affordable housing owners also locking in debt before conditions shift. Origination volume accelerated to a peak of $5.6B in March before moderating.
Gateway and Sun Belt Markets Capture Most Agency Capital
Top markets for Fannie Mae capital in 2026 reflect both established and high-growth metros. New York–Newark–Jersey City led with $1.6B in multifamily volume. Next in line were San Jose–Sunnyvale–Santa Clara at $0.75B and Los Angeles–Long Beach–Anaheim with $0.72B. Sun Belt hubs continued to win agency dollars—Phoenix, Miami–Fort Lauderdale, and Dallas–Fort Worth each landed $0.6B–$0.7B amid strong population and rent growth drivers. These deployment patterns mirror investor appetites and demographic trends seen across recent agency cycles.
Why It Matters
The 2026 Fannie Mae multifamily lending market shows how concentrated the agency channel has become. Refinancing now drives far more activity than acquisitions. The ten largest lenders controlled 78% of all originations through mid-May. Large DUS lenders continue to strengthen their position through scale and relationships. Borrowers face intense competition when seeking favorable financing terms. Meanwhile, lenders continue expanding high-volume, refinance-focused businesses as debt maturities approach. Investors can use agency lending activity to identify emerging liquidity trends and potential repricing pressure across markets.
What’s Next
The second half of 2026 will test the strength of the refinance wave. Borrowers still face maturing loans, while interest rate volatility remains a factor. Market participants should watch for changes in origination activity if transaction volume improves later this year. Regulatory adjustments to Fannie Mae volume caps could also shift lender behavior. CRED iQ will continue tracking lender strategies, loan pipelines, and capital deployment trends. Sun Belt and gateway markets will likely remain key destinations for agency capital.