



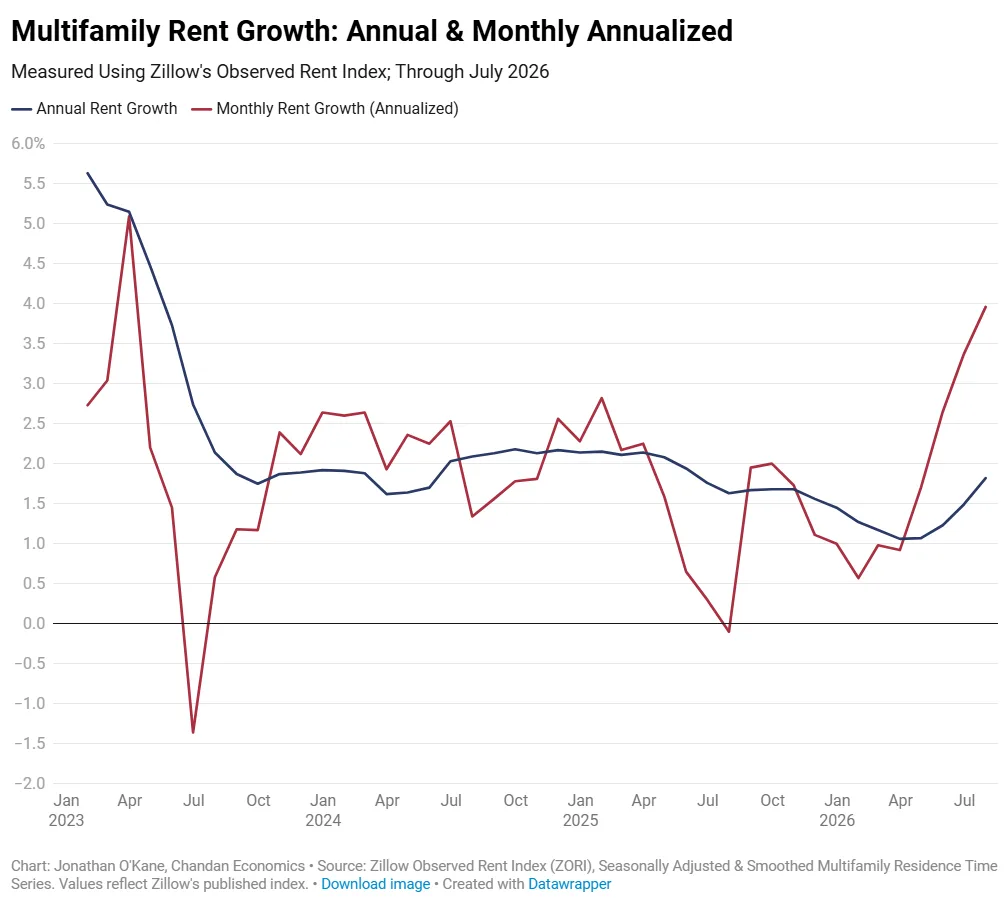
- National multifamily rent growth reached 1.8% year-over-year in July 2026, the fastest annual rate since May 2025, per Chandan Economics analysis of ZORI data.
- The share of US metros with monthly rent gains hit 73.4%, the highest since September 2025, reflecting broader market participation.
- While Sun Belt markets still underperform annually, several have posted monthly gains, indicating early signs of stabilization in lagging regions.
Pace of Growth Surges After Lull
US multifamily rent growth reversed its cooling trend in July 2026, with both annual and short-term measures rising for a fourth consecutive month, according to a Chandan Economics review of the Zillow Observed Rent Index. The July increase of 1.8% year-over-year outpaced June’s 1.5% and marks the swiftest annual rent growth since May 2025. This momentum follows a period of weaker growth that hit a low in March, but the current data signals a market moving beyond stabilization toward modest acceleration.
Short-term indicators strengthened even more, with month-over-month annualized rent growth climbing to 4.0%—the fastest since March 2023. Notably, 73.4% of US metros recorded monthly rent gains, while nearly 89% posted year-over-year increases. This growing breadth indicates that moderate rent increases are becoming more widespread after a prolonged period of uneven recovery across the country.
Get Smarter about what matters in CRE
Stay ahead of trends in commercial real estate with CRE Daily – the free newsletter delivering everything you need to start your day in just 5-minutes
The Details
National apartment rents grew by 1.8% year-over-year in July, per Chandan Economics’ analysis of ZORI’s seasonally adjusted, smoothed data. The annualized month-over-month rent growth, a proxy for recent momentum, hit 4.0%. The share of metros seeing positive monthly rent growth climbed for the fourth straight month, reaching 73.4%—up from 72.3% in June and marking the highest participation rate since September 2025. Likewise, 88.8% of metros had positive annual growth in July.
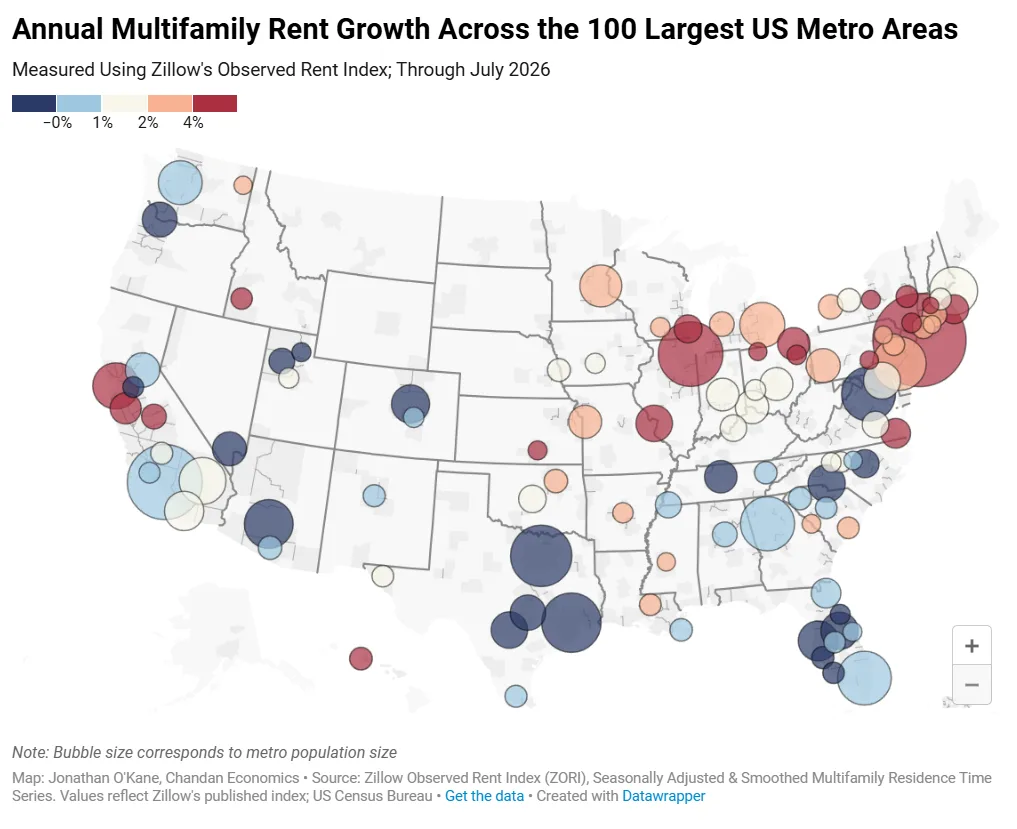
San Francisco led the nation with 10.3% annual rent growth, followed by Toledo (7.3%), San Jose (7.3%), Akron (6.6%), and Virginia Beach (6.5%). At the opposite end, North Port, San Antonio, and Cape Coral all posted annual declines greater than 3%. On a monthly basis, top performers included San Francisco (+1.6%), Toledo (+1.3%), and Augusta (+1.2%). Meanwhile, typical soft spots like Austin, Raleigh, Phoenix, and Denver—though negative year-over-year—showed positive monthly movement.
Uneven Recovery Gains Nuance
Multifamily rent growth continues to split sharply along geographic lines, with Northern California, select Midwest, and Northeast metros showing the most robust gains. In contrast, several Sun Belt and Mountain West metros remain constrained by oversupply, a challenge that followed a broader period of slowing rent growth as markets adjusted after reaching the lowest growth levels since 2021. This has resulted in persistent annual rent declines. However, this divide is starting to look more nuanced: sluggish Sun Belt markets such as Austin, Denver, and Phoenix registered positive rent growth for the month of July, hinting at local stabilization even if broader annual numbers have yet to turn the corner.
San Francisco’s 10.3% annual surge stands out amid these trends, underpinned by strong demand, little new supply, and a still-tight vacancy environment. The market’s sustained outperformance demonstrates what can happen when local factors align in spite of broader national headwinds.
Why It Matters
The July apartment rent report is the clearest sign to date that national rent growth has moved beyond mere stabilization. With both annual and short-term growth rates climbing and a higher percentage of metros reporting monthly gains, the market is experiencing its most widespread expansion in nearly a year. For investors, this suggests that the worst of the cooling cycle is in the rearview mirror and that fundamentals are recovering, albeit at a more modest pace than the overheating seen during the pandemic boom years.
Despite this national reacceleration, there is little evidence of uniform recovery. Supply pipelines, especially in Sun Belt metros, continue to dictate regional performance. As noted in Chandan Economics’ analysis, markets like North Port, San Antonio, and Cape Coral are still posting meaningful annual rent drops. Yet the fact that some of these metros are showing positive monthly growth is an early indicator that absorption may be catching up to deliveries. For operators, this means close monitoring of local trends remains essential, as blend rates and operational strategies will need to flex with continued unevenness across markets. According to the latest ZORI release, more metros now have the wind at their backs, but the road to full balance is neither smooth nor guaranteed.
What’s Next
The breadth of positive monthly rent growth raises the odds that national rent trends will remain constructive through the remainder of 2026, provided labor markets and consumer sentiment hold. Markets like San Francisco and the Midwest should continue to outperform, while lagging Sun Belt metros may slowly find firmer footing as their supply/demand fundamentals adjust. Investors, lenders, and operators should watch closely for signs of more decisive recovery in high-supply markets, as renewed absorption and capital flows could signal the next phase of the apartment market cycle. Continued tracking of metro-level data will be critical for spotting which regions are poised for a faster rebound—and which may remain stuck in neutral.