




- Apartment renter cost burdens increased in nearly every major US metro from 2019 to 2022, reversing pre-pandemic improvements.
- Sharpest cost burden jumps were concentrated in Sun Belt metros and select cities like Columbus and Virginia Beach, with rises over 9 percentage points.
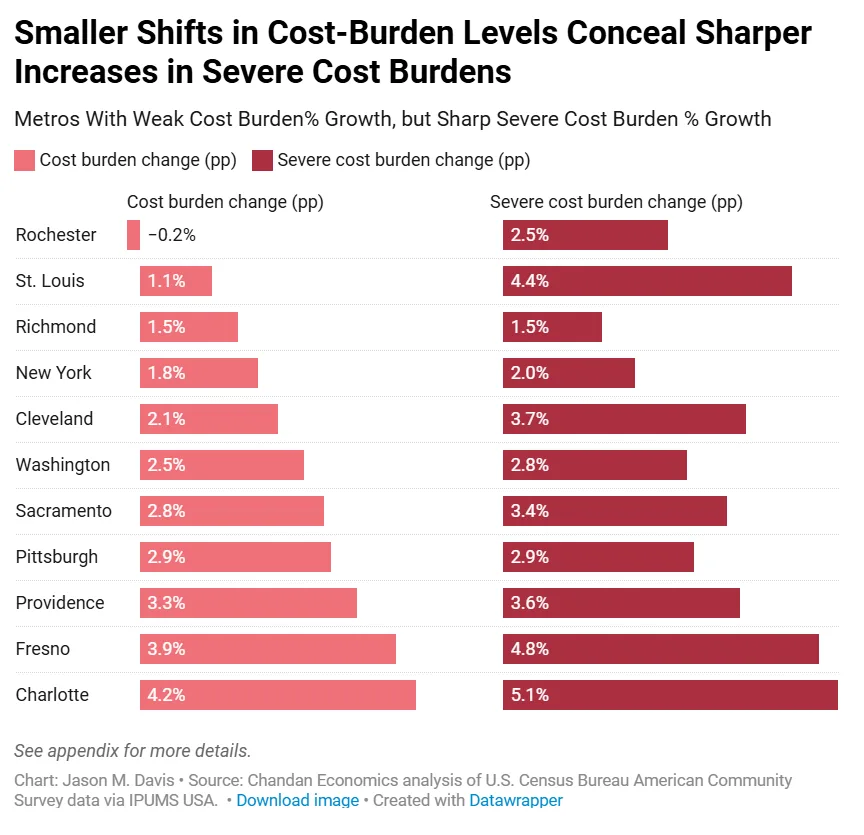
- Many metros with small average cost burden growth saw much sharper spikes in severe cost burdens, indicating hidden pockets of distress.
Headline Metrics Miss Sub-Surface Strains
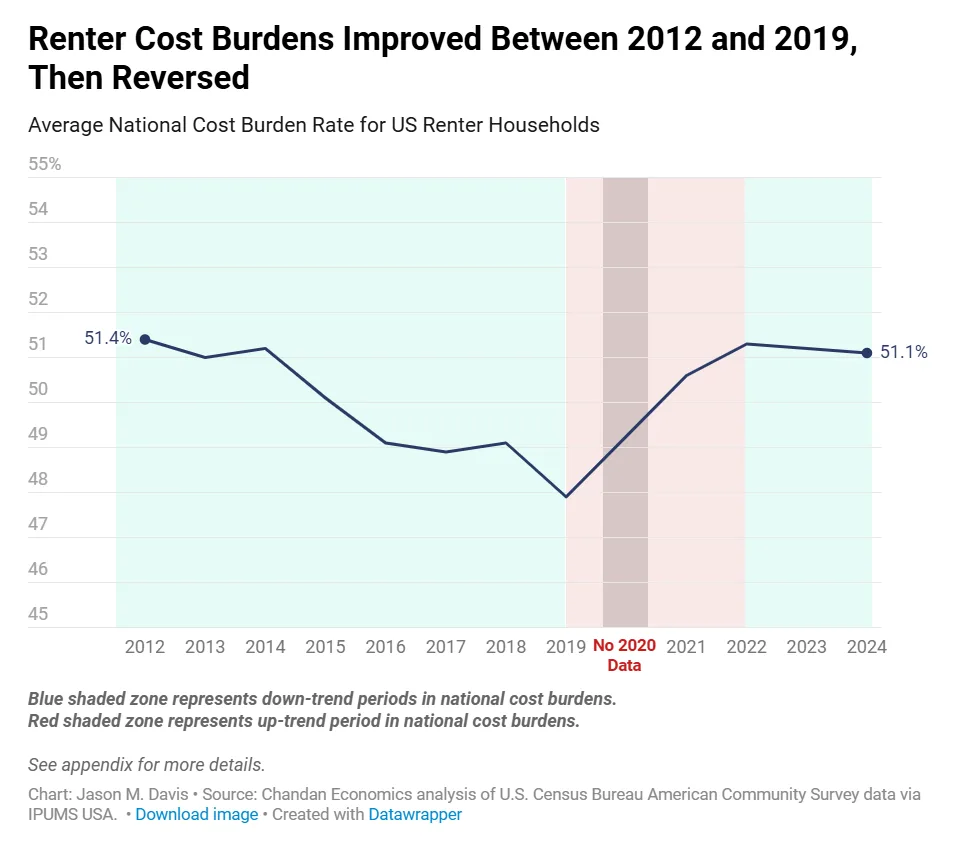
According to an analysis by Chandan Economics, apartment renter cost burdens rose across nearly all major US metros following the onset of the pandemic, with much of the increase evident by 2021. While about half of American renters now spend at least 30% of their income on rent—a rate returning to 2012 levels—the story is far from uniform across cities.
Nationally, cost-burdened renter rates declined from 51.4% in 2012 to 47.9% in 2019 before surging to 51.1% in 2024. Davis notes that although the post-pandemic average increases look modest in some metros, these numbers often disguise much sharper affordability impacts for the most at-risk households.
Get Smarter about what matters in CRE
Stay ahead of trends in commercial real estate with CRE Daily – the free newsletter delivering everything you need to start your day in just 5-minutes
The Details
Renter cost burdens worsened in nearly every top-50 US metro from 2019 to 2022, with only San Jose and Rochester recording overall improvements since 2019. The metros with the steepest burden increases since 2019 included Columbus and Virginia Beach (each with over 9 percentage point jumps), along with substantial rises in Tampa, Nashville, Jacksonville, Las Vegas, and Raleigh, all registering between 7.2 and 8.8 points.
Another set of metros—such as Dallas, Houston, Seattle, and San Francisco—posted more moderate surges in the 3.0 to 6.0 percentage point range. Conversely, markets like Austin, San Diego, Denver, and Washington saw shifts of under 3.0 points, and both San Jose and Denver actually improved or remained flat. Each city’s circumstances and supply/demand fundamentals contributed uniquely to these shifts, per Davis’s analysis.
Sun Belt Influxes vs. Tech Market Pressures
In the Sun Belt, cost burden spikes hit early in the pandemic as heavy domestic migration met constrained housing supply, fueling rapid rent hikes. Tampa, Jacksonville, and Nashville exemplify this pattern, with significant early-2020s increases. Even as renter demand has cooled in some markets, affordability pressures have continued to build, showing that slower leasing activity alone has not eased financial strain. Meanwhile, West Coast tech hubs like Seattle and San Francisco faced later surges in cost burden rates as tech-sector hiring, AI demand, and back-to-office policies reignited competition in already supply-strained markets.
Interestingly, pre-2019 trends provided little predictive value for pandemic-era volatility. For example, both Columbus and Virginia Beach, which had seen significant improvements pre-pandemic, logged the largest post-2019 reversals. In contrast, Las Vegas and San Antonio’s cost burdens worsened further on already negative trajectories.
Why It Matters
Reporting from the Housing and Urban Affairs sector shows that about 51% of US renters are now considered cost-burdened. The overall US trend line masks more intense reversals and severe burdens in certain cities and subgroups. Severe cost burdens—where households spend over half their income on rent—are rising fastest in places where average cost burdens appear stable. In St. Louis, for example, the average cost burden increased just 1.1 percentage points from 2019-2024, but the severe cost burden rate jumped 4.4 points, quadrupling the headline metric’s rise. Rochester exemplifies another version: overall cost burden improved, yet severe renters climbed by 2.5 points. This suggests that relying solely on topline averages can cause policymakers and CRE investors to overlook worsening distress among lower-income renters.
Data from 2022 and 2023 suggests that the flood of new multifamily completions softened rent increases in fast-growing metros, but did little to address chronic affordability issues for the most vulnerable renter segments. The divergent paths of severe and non-severe cost burdens underscore that market-rate supply increases are often insufficient for deep affordability solutions, as severe burdens continue to quietly rise under the surface of stabilizing averages.
What’s Next
The industry’s attention is shifting to the severe cost-burden segment as a distinct axis of analysis, with implications for investment strategies, local policy, and affordable housing supply initiatives. Ongoing rent control debates and targeted subsidy programs may increase in metros where severe cost burdens spike ahead of averages. For CRE operators and investors, this highlights the need for granular market reads—average figures alone can obscure sharp affordability stress that influences demand, retention, and payment risk. As 2024 moves forward, tracking both average and severe cost burden rates will be essential for spotting inflection points and emerging risks in US multifamily fundamentals.