






- NAA’s latest Dollar of Rent analysis finds 89 cents of each 2025 rent dollar went to debt service, operations, taxes, payroll and reserves, leaving about 11 cents for owners.
- Same-store revenue grew 2.7% to $1,545 per unit monthly while operating expenses rose 4.6% to $8,213 per unit annually, in both market-rate and affordable communities.
- Utilities, insurance and property taxes outran rents, and a thinner margin tends to delay renovations, technology upgrades and new development.
Apartment owners held on to roughly 11 cents of each rent dollar in 2025, according to the National Apartment Association’s latest Dollar of Rent study. The remaining 89 cents went to debt service, running the buildings, taxes, staff and reserves.
NAA says the squeeze is tightening because costs are climbing faster than the revenue they come out of.
Get Smarter about what matters in CRE
Stay ahead of trends in commercial real estate with CRE Daily – the free newsletter delivering everything you need to start your day in just 5-minutes
Where the Money Went
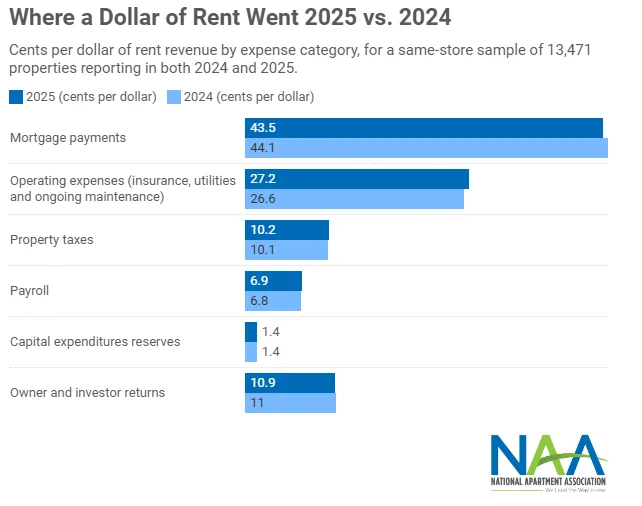
Mortgage payments were the biggest bite at 43 cents. Another 27 cents covered the daily cost of operating a property, from insurance and utilities to upkeep and management fees.
Property taxes took 10 cents, payroll 7 cents and capital reserves 1 cent. Owners’ share slipped a little from 2024, NAA found, because operating costs grew.
Expenses Outrun Revenue
NAA tracked the same 13,471 communities, about 1.7 million apartments, across 2024 and 2025 using operating statements supplied by STATVAL. Holding the sample fixed isolates real change from shifts in which properties report. Each cost is expressed in cents by dividing its average per-unit expense by average rental revenue per unit, so totals can miss 100 cents because of rounding, NAA said.
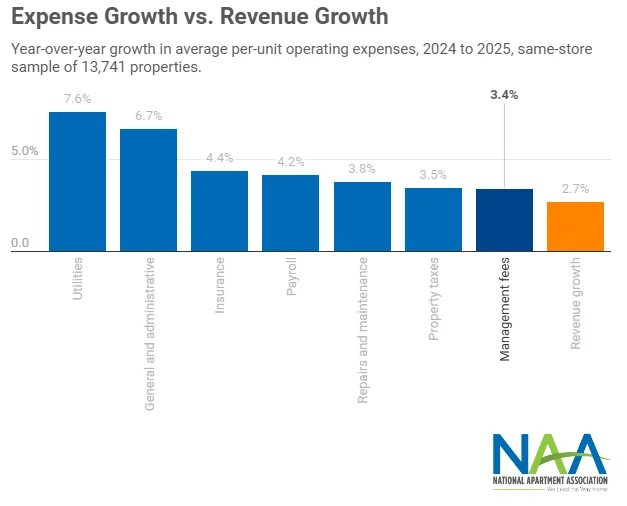
NAA’s Dollar of Rent Tool also offers national, state, metro and congressional district breakdowns. Monthly revenue per unit grew 2.7%, from about $1,504 to $1,545. Annual operating cost per unit rose 4.6%, to $8,213 from $7,848, nearly double the pace of income.
Market-Rate and Affordable Alike
The squeeze showed up in both segments. Market-rate properties saw revenue rise 2.4% against a 4.6% expense increase, while affordable properties posted 2.9% revenue growth versus that same 4.6%.
NAA said no major cost category lagged rents, with water, energy and waste charges leading the increases.
The Costs Owners Cannot Negotiate
Insurance premiums kept rising on top of steep gains in recent years, NAA noted, and property taxes grew again despite already being the largest single operating expense.
Tax assessments, insurance pricing and utility tariffs are determined by others, yet they land on the owner’s operating statement, which limits what a property manager can offset.
Why It Matters
NAA argues that the 11 cents is more than profit. It cushions an unexpected insurance bill, a broken boiler or a slow leasing season, and it is the payoff that keeps investors financing new communities.
When that cushion thins, NAA warns, upgrades that residents never see tend to go first: renovations, technology and development plans. The squeeze compounds a slow rent recovery and ties directly into NOI and apartment pricing.
What’s Next
NAA points to passage of the 21st Century ROAD to Housing Act as evidence of bipartisan appetite for supply-focused policy, and says it helped get the bill across the finish line.
The group says it will keep working on implementation while pressing to cut regulatory costs that raise the price of housing. Watch whether expense growth cools in 2026, since NAA contends lasting affordability depends on the cost side of the ledger.