


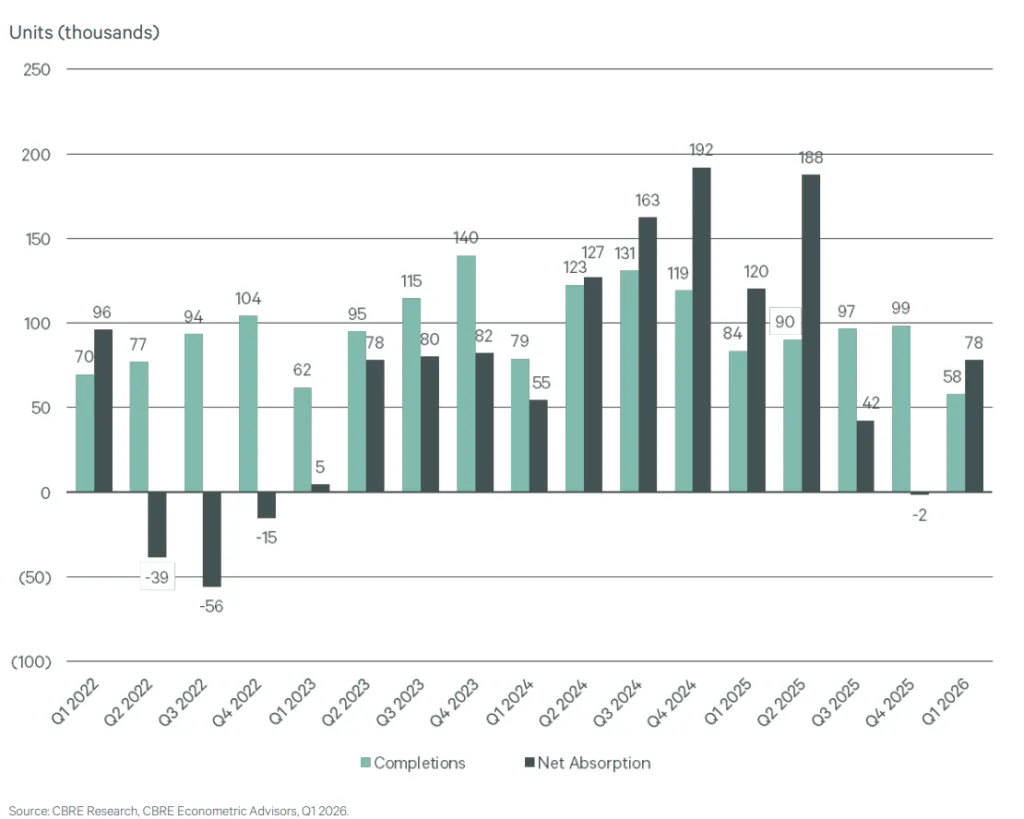
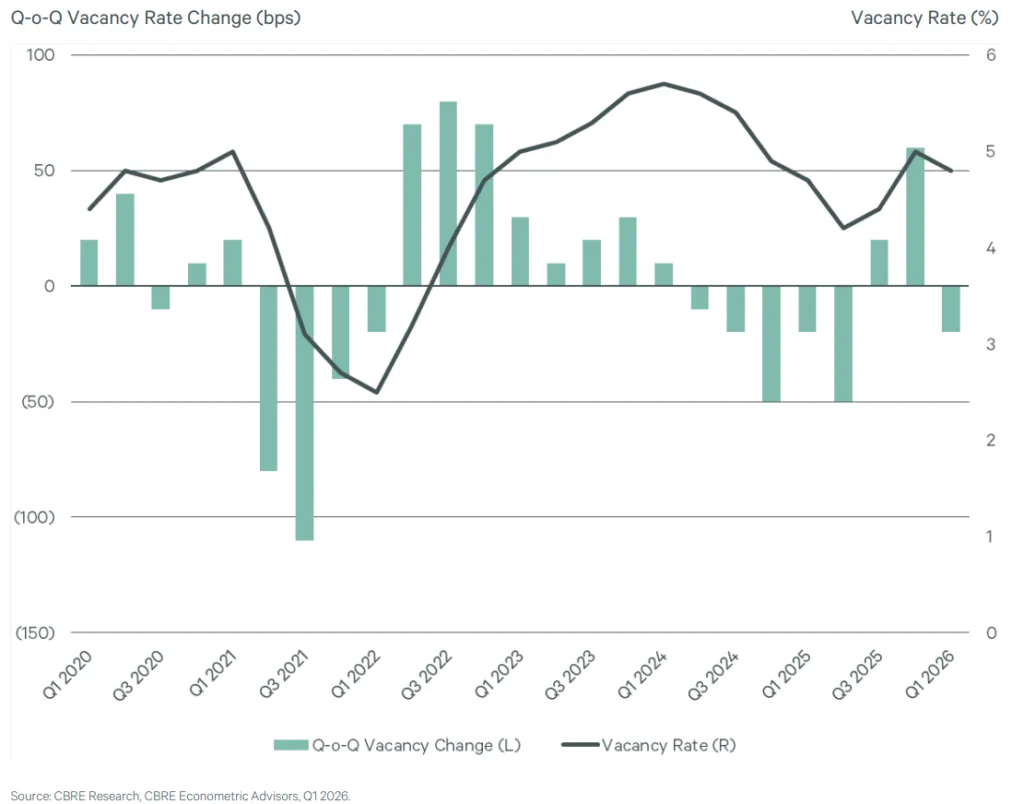
- Multifamily absorption reached 78,100 units in Q1 2026, surpassing the 58,100 units delivered and lowering the national vacancy rate to 4.8%.
- Sun Belt markets continued to dominate leasing activity, while gateway metros like New York led both absorption and investment volume.
- Slowing construction deliveries and stabilizing rents suggest multifamily fundamentals may be entering a more balanced phase after two years of supply pressure.
US multifamily fundamentals improved in Q1 2026 as renter demand rebounded faster than new supply deliveries, according to CBRE’s latest quarterly report. Net absorption climbed to 78,100 units during the quarter, reversing the 1,500 units of negative absorption recorded in Q4 2025 and helping pull the national vacancy rate down to 4.8%. Average monthly rent also edged higher to $2,217, signaling that pricing may finally be stabilizing after months of pressure in high-supply markets.
Demand Finally Catches Supply
Q1 marked the first quarter in three periods where demand exceeded new multifamily completions nationwide. CBRE reported 58,100 new units delivered during the quarter, down 30% year-over-year. Meanwhile, rolling four-quarter completions continued slowing after the development wave peaked in 2024. The market now appears to absorb the record pipeline that pressured occupancy and rents during the past two years.
Sixty-three of the 69 markets tracked by CBRE posted positive net absorption in Q1, up sharply from just 26 markets in Q4 2025. New York led the country with 5,600 absorbed units, followed by Dallas with 4,200 and Phoenix with 3,200. Denver, Chicago, and Washington, DC posted some of the largest quarter-over-quarter reversals from negative demand.
Get Smarter about what matters in CRE
Stay ahead of trends in commercial real estate with CRE Daily – the free newsletter delivering everything you need to start your day in just 5-minutes
The Details
Construction activity remains elevated, but the pipeline is clearly shrinking. CBRE counted 569,200 units under construction nationally in Q1 2026, down from a peak of 760,400 units one year earlier. New York had the largest pipeline with 54,000 units underway, followed by Dallas with 28,200 and Houston with 24,100. Developers have also started slowing new apartment deliveries as financing costs and weaker rent growth pressure project economics in several major markets.
Vacancy trends also improved across asset classes. Class A vacancy fell 20 basis points quarter-over-quarter to 5.1%, while Class B declined to 4.9%. Class C held steady at 4.7%, slightly below its pre-pandemic average. Honolulu and New York posted the nation’s tightest vacancy rates at 2.7% and 2.9%, respectively, according to CBRE.
Rent growth, while modest, showed signs of stabilizing. National rents increased 0.2% year-over-year and 0.4% quarter-over-quarter in Q1. The Midwest led all regions with 2.2% annual rent growth, followed by the Northeast at 1.6%. Sun Belt markets continued seeing softer pricing due to supply pressure, though CBRE noted that rent declines in regions like the Mountain West and South Central US are beginning to moderate.

A Tale of Two Multifamily Markets
The data highlights the widening divide between supply-heavy Sun Belt metros and tighter gateway markets. Austin, Denver, and San Antonio recorded some of the steepest annual rent declines as developers continue delivering large waves of new product. Meanwhile, gateway cities including New York, San Francisco, and Washington, DC are seeing renewed investor and renter interest as construction pipelines normalize.
Investment activity reflected that divergence. Total multifamily investment volume fell 6% year-over-year to $29.5B in Q1 2026, but trailing four-quarter volume rose 4.8% to $165.8B, according to CBRE and MSCI Real Assets. New York led the nation with $14.7B in trailing annual investment volume, followed by Los Angeles at $9.4B and Dallas-Fort Worth at $8.9B. Gateway markets collectively accounted for 31% of US multifamily investment over the past four quarters.
Why It Matters
The multifamily sector may be moving beyond its worst supply-demand imbalance. During 2024 and 2025, record deliveries outpaced renter demand. As a result, vacancies climbed and landlords offered concessions across major Sun Belt markets. However, Q1 data suggests conditions are improving. Slower construction starts and steady job growth now support leasing demand and pricing power.
That shift matters for owners and lenders alike. Stabilizing occupancy and rents could ease refinancing pressure for borrowers facing near-term maturities. Class A properties may benefit most because they absorbed much of the recent supply wave. Meanwhile, investors may see slower deliveries as a sign that multifamily pricing is nearing a cyclical bottom.
What’s Next
CBRE expects completions to decline through the rest of 2026. Lower supply could tighten vacancies and support rent growth if demand remains stable. Markets with large pipelines, including New York, Dallas, Charlotte, and Austin, will show how quickly multifamily can rebalance.
Meanwhile, investors continue tracking capital markets closely. Multifamily cap rates rose 10 basis points to 5.8% in Q1, according to CBRE. Industrial also surpassed apartments for the largest share of quarterly CRE investment volume. That marked the first time since 2017. Multifamily’s recovery now depends on improving operating fundamentals.