







- Median LTV on securitized manufactured housing loans is 58.2% in 2026, up from 55.0% in 2022 but below the 65.0% median in 2019.
- Agency lenders Fannie Mae and Freddie Mac hold about 85% of the $35.38 billion analyzed and sit at 55.1%, while conduit loans hit 64.5% and CRE CLOs 60.9%.
- Securitization volume is on pace for $3.60 billion in 2026, down about 14% from 2025, as conduit and CLO lenders push leverage while agencies hold steady.
Debt on manufactured housing communities is getting a bit more leveraged, but not back to old highs, per Trepp’s analysis of LTVs.
Across securitized loans, the 2026 median stands at 58.2%. That compares with a trough of 55.0% in 2022 and 65.0% in 2019.
Get Smarter about what matters in CRE
Stay ahead of trends in commercial real estate with CRE Daily – the free newsletter delivering everything you need to start your day in just 5-minutes
Volume Is Cooling
Lenders securitized $2.70 billion of these loans through September. Annualized, that points to roughly $3.60 billion for 2026, about 14% below 2025’s $4.17 billion.
The recent peak was $8.14 billion in 2020, and 2022 came in at $3.51 billion.
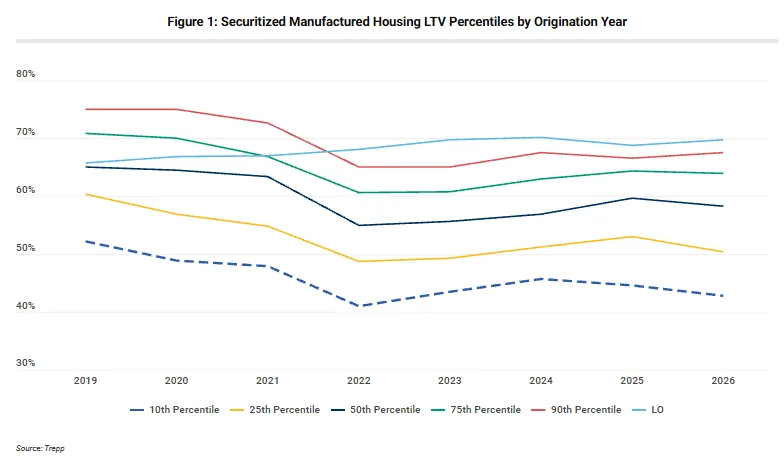
Agency vs. Conduit
Fannie Mae and Freddie Mac dominate, with $29.96 billion, about 85%, of the $35.38 billion in Trepp’s data. Conduit CMBS accounts for $3.94 billion and CRE CLOs for $1.48 billion.
Agency leverage has barely budged. Their 2026 median is 55.1%, only 10 basis points above 2022 and far under 2019’s 65.0%. Fannie Mae loans average 54.0% and Freddie Mac’s 58.4%.
Conduit and CLO Lenders Lean In
Conduit lenders have returned to pre-pandemic territory. Loans written this year carry a 64.5% median, compared with 55.2% in 2022 and 64.2% in 2019.
CRE CLOs have gone past it, at 60.9% versus 52.3% in 2022 and 57.2% in 2019.
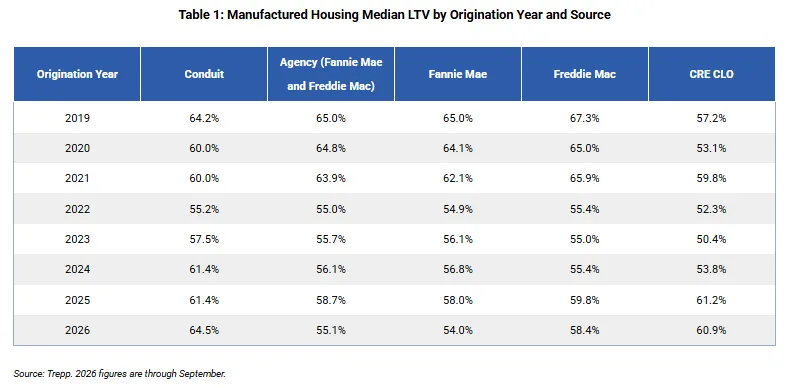
Vintage by Vintage
The origination-year table tells the story. Conduit LTVs climbed each year after 2022: 55.2%, then 57.5%, 61.4% for both 2024 and 2025, and 64.5% now.
CRE CLO loans went from 50.4% in 2023 to 61.2% in 2025 before easing slightly to 60.9%. Agency loans from 2025 averaged 58.7%, so this year’s 55.1% is actually a step back.
Why It Matters
The numbers show two lender mindsets. Agencies are holding the line, and because they hold most of the debt, they keep sector-wide leverage low.
Trepp cautions that LTV is only one gauge of lender risk appetite. Fundamentals also help explain lender comfort. CRE Daily’s brief on 6.2% rent growth cited Marcus & Millichap data showing large manufactured housing markets outpacing apartments, with cap rates near 7%.
What’s Next
Watch whether conduit and CLO lenders keep stretching while agencies stay put. Agencies hold roughly 85% of the debt, so their caution is likely to keep sector-wide leverage in check.