








- CRE lending surged, with CBRE’s Lending Momentum Index up 45% YoY in Q2 2025, led by alternative lenders and debt funds.rn
- After sharp increases in 2022, RERC cap rates held stable across most property types, with modest compression in data centers, industrial Ru0026D, regional malls, and student housing.rn
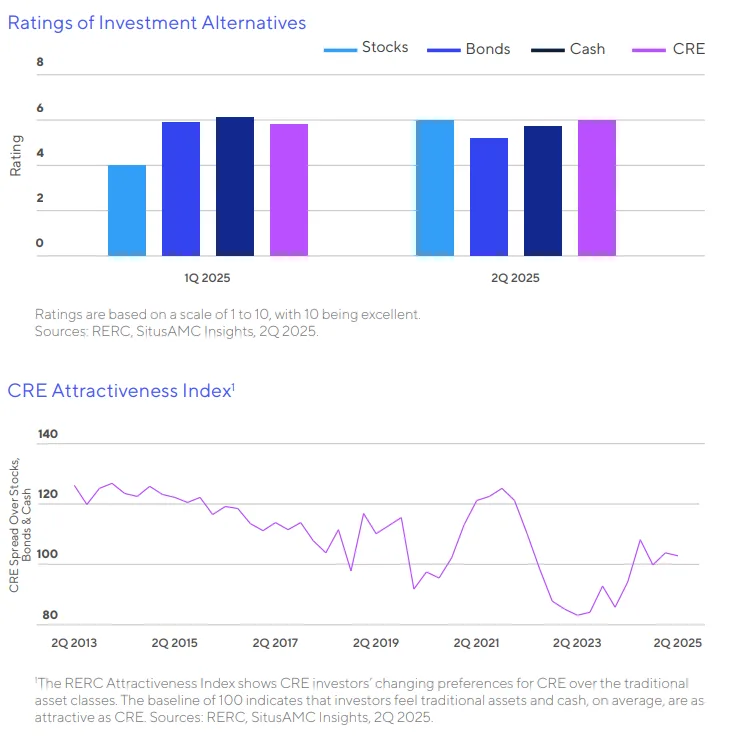
- SitusAMC’s quarterly survey shows stronger preference for CRE relative to bonds and cash, with investors citing the sector’s “safe haven” appeal despite volatility from tariffs and inflation.rn
- June was 2025’s most active month to date with $38B in volume, but transactions remain 16% below last year and 20% under the 8-year average. Retail, multifamily, and industrial led gains, while office and hotel lagged.rnrnrn
A Slow Shift Beneath the Surface
The cre market may still feel “stuck” to many investors, but the latest data from SitusAMC suggests movement is underway. With the 10-year Treasury yield hovering between 4.2% and 4.4% this summer, financing costs remain elevated but stable. Debt fund activity surged nearly 90% QoQ, making alternative lenders the largest source of non-agency originations at 34% of the market—up from less than 20% just five years ago.
Returns Turning the Corner
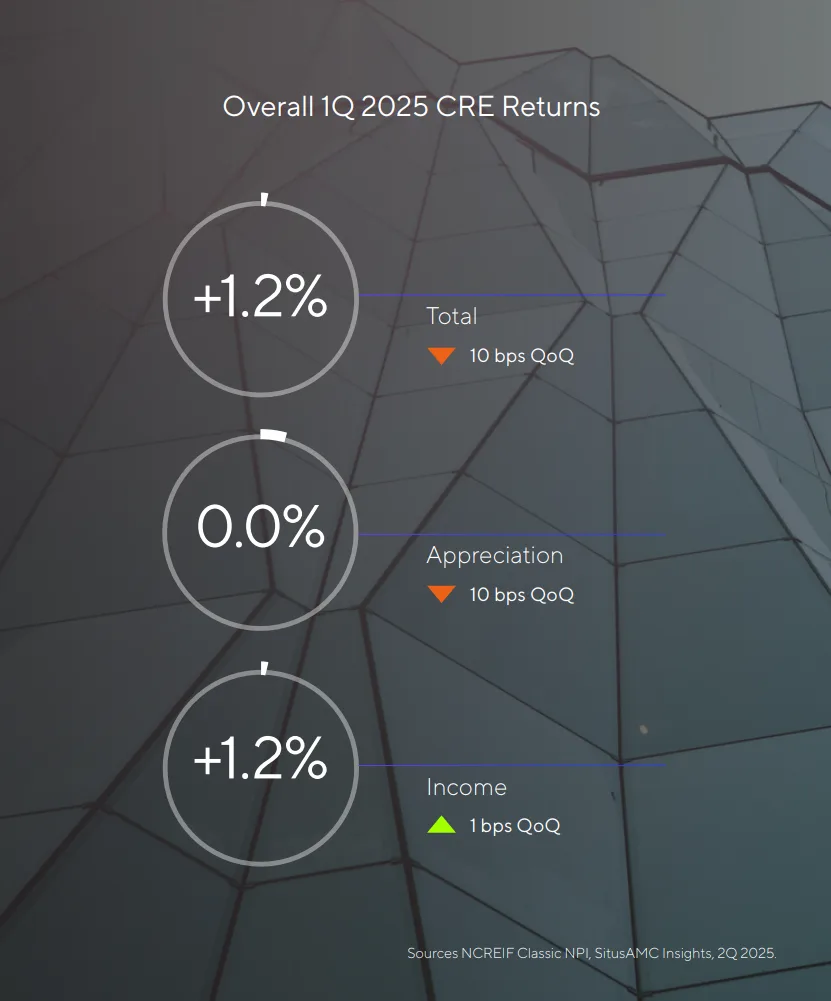
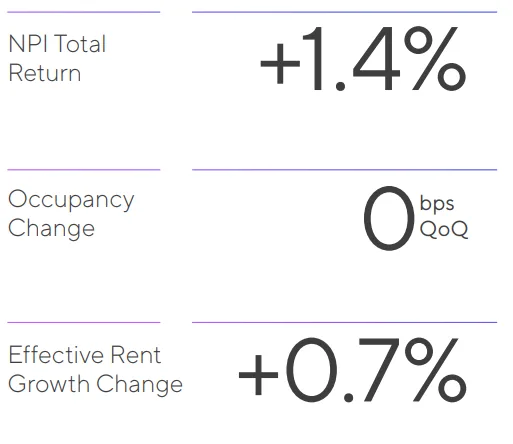
After a prolonged downturn, CRE returns are back in positive territory. The NCREIF NPI recorded one-year trailing returns of 4.2%, the strongest since late 2022. Apartments logged their fifth consecutive quarter of appreciation, while retail outperformed with 1.9% quarterly returns, the highest among major property types.
Industrial remains resilient long-term but posted its weakest performance in four years, while office continued its slide, with occupancy below 80% for a fifth straight quarter. Hotels, weighed down by weaker international tourism, saw the sharpest drop in fundamentals with RevPAR declining to its lowest level in over a year.
Transaction Volume: Retail Stands Out
Deal activity in June highlighted a bifurcated market:
- Retail: $6B in trades (+34% MoM), the only property type above its long-term average.
- Apartments: $12.5B (+23% MoM), supported by portfolio sales.
- Industrial: $8.5B (+10% MoM), maintaining investor appeal despite slower rent growth.
- Office: $5.5B (–18% MoM), now 40% below its LTA, with only 9% of surveyed investors favoring the segment.
- Hotels: $1.5B (–47% MoM), reflecting deep investor skepticism.
What’s Next
While overall cre prices remain flat, stability in cap rates and dry powder waiting on the sidelines suggest the market could be positioned for a stronger rebound in 2026. Investors in SitusAMC’s survey overwhelmingly recommended a “hold” strategy across property types, with selective interest in multifamily, student housing, and neighborhood retail.
As one institutional investor put it: “With low deal flow over the past several years, investors want to invest and lenders want to lend.”
Get Smarter about what matters in CRE
Stay ahead of trends in commercial real estate with CRE Daily – the free newsletter delivering everything you need to start your day in just 5-minutes