







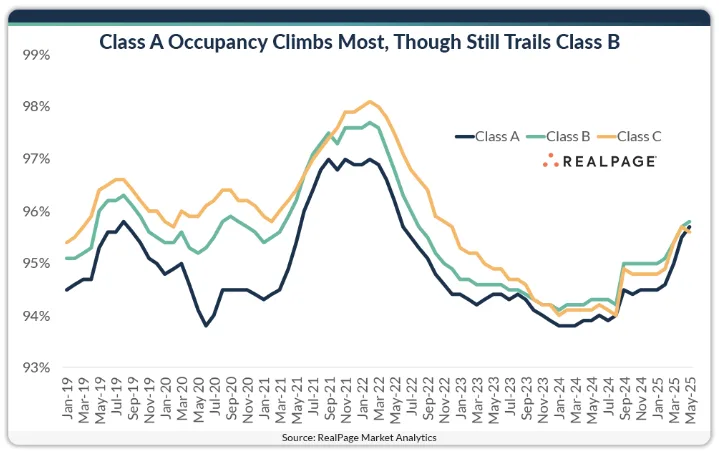
- Stabilized Class A apartment occupancy reached 95.7% in May, the highest level since mid-2022.rn
- Class B units maintained the highest occupancy at 95.8%, followed closely by Class C at 95.6%.rn
- Class A saw the strongest year-over-year improvement, up 170 basis points.rn
- For the first time since the pandemic, all three asset classes now exceed their pre-COVID occupancy averages.
A Clear Upturn for Class A
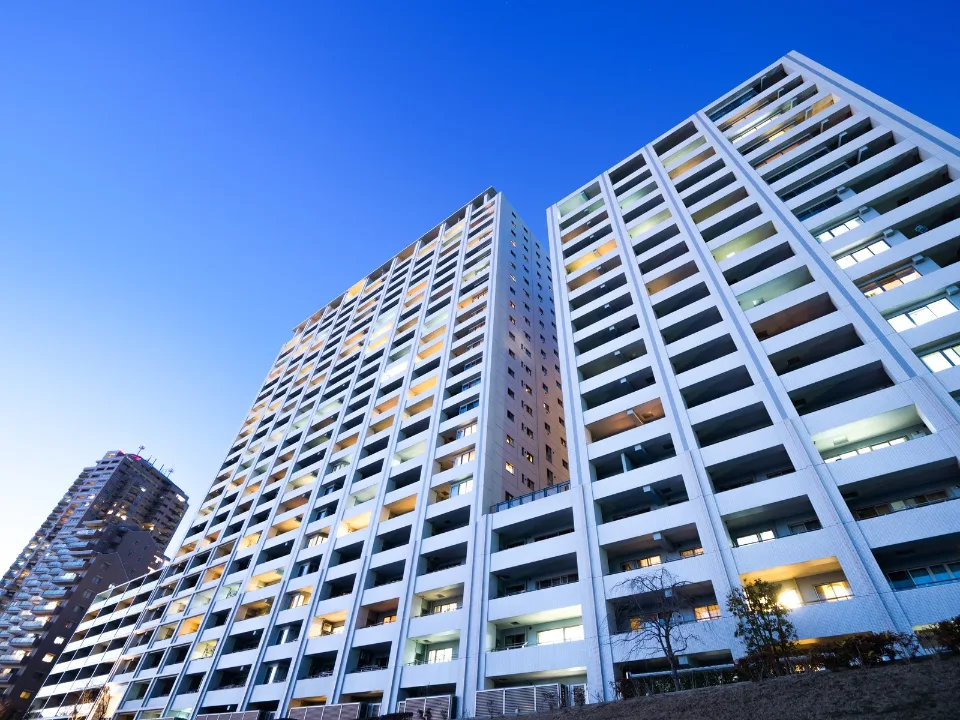
After several years of lagging behind, Class A occupancy is finally catching up. In May, occupancy in stabilized luxury apartments climbed to 95.7%, according to RealPage Market Analytics. That figure represents the highest A rate recorded since June 2022 and a 170 basis point increase over the same time last year.
While still just below Class B’s 95.8% mark, this gain shows meaningful progress. It also signals a shift in demand toward higher-end apartments, even as affordability remains a concern for many renters.
Historical Norms Reversed
Traditionally, Class C units have led the pack when it comes to occupancy. Between 2015 and 2019, Class C properties averaged a 95.4% occupancy rate, with Class B close behind at 95.3%. Class A trailed both, averaging just 94.7% during that same period.
This hierarchy reflected broader renter behavior. Budget-conscious tenants tended to remain longer in more affordable units, while A renters—more likely to buy homes—showed higher turnover. In addition, new supply often diluted demand in the luxury segment.
Get Smarter about what matters in CRE
Stay ahead of trends in commercial real estate with CRE Daily – the free newsletter delivering everything you need to start your day in just 5-minutes
Post-Pandemic Shifts
Since late 2023, occupancy patterns have shifted. Class B properties have consistently held the highest rates, driven by a combination of affordability and location advantages. Class C units remain close behind, supported by strong demand from workforce renters.
Meanwhile, Class A properties have had to contend with increased competition. The steady pipeline of new developments, along with frequent move-outs for home purchases, kept occupancy growth in check—until recently.
Strength Across the Board
Importantly, May’s data shows that occupancy across all asset classes now exceeds pre-pandemic five-year averages. This points to broad-based strength in the rental market, not just a temporary bump in one segment.
A’s strong rebound suggests that high-end renters may be less cautious than in recent years. That could reflect growing economic confidence or a shift in consumer preferences toward flexible, urban lifestyles over homeownership.
Why It Matters
Class A apartments are the most sensitive to new supply. They also lose renters more often due to home purchases. So, a strong recovery in Class A shows renters are returning to premium units. This could reflect growing confidence in the economy—or shifting lifestyle preferences.
What Comes Next
If demand holds steady, A occupancy could keep rising. But with more new units set to open, competition will remain high. Developers and investors will need to watch closely in the coming months.