





- US office rents rose 9.5% year-over-year in June 2026, but CompStak and Columbia data shows slowing momentum.
- Retail posted robust gains, with major MSAs like New York and Chicago exceeding 11% annual growth, while industrial results varied widely.
- The CCRI’s quality-adjusted rent tracking reveals critical sector and market splits, helping investors and lenders parse recent versus long-term trends.
Methodology Redraws the CRE Rent Map
CompStak and Columbia Business School’s Constant-Quality Rent Index (CCRI) represents a departure from conventional rental benchmarks. According to the August 2026 national update, the CCRI eschews simple asking rent averages for a deeper analysis of verified transaction data, quality-mix controls, and rental concessions.
This design provides CRE professionals with a net-effective rent reading that more accurately reflects real-world dealmaking in US office, retail, and industrial markets. With one of the largest lease data sets in the industry, CompStak’s monthly CCRI brings fresh transparency to trends often distorted by headline averages—one reason its read on sector performance is drawing attention from institutional capital, lenders, and operators alike.
Get Smarter about what matters in CRE
Stay ahead of trends in commercial real estate with CRE Daily – the free newsletter delivering everything you need to start your day in just 5-minutes
The Details
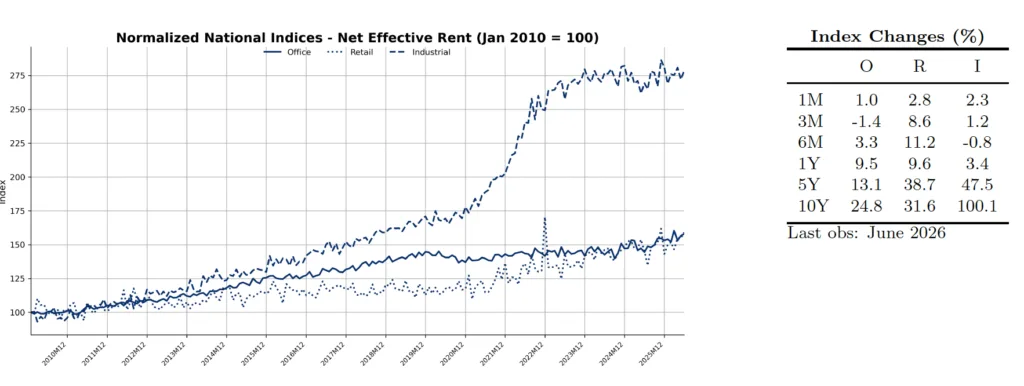
Per CompStak and Columbia’s August 14, 2026 CCRI update, all three tracked property sectors logged year-over-year net effective rent growth at the national level. Office led with a 9.5% increase for the trailing twelve months to June, though the latest data suggests the sector’s recovery momentum is moderating.
Retail rents continued to accelerate across both short- and long-term horizons, with top MSAs such as New York posting +11.7% annual growth on $391M of quarterly volume. Industrial showed more modest expansion, but figures diverged sharply by market: Sacramento reported +22.5%, while major Southern California hubs like Los Angeles and Riverside saw rare outright declines of 2.4% and 2.5%, respectively.
Source: CompStak and Columbia
Momentums and Market Splits Reshape the Landscape
The index uses both year-over-year growth (the market baseline) and quarter-over-quarter trends (momentum) to classify markets into categories such as Surging, Rebounding, Cooling, or Sluggish. In office, the cross-section skews toward either robust growth or marked declines, with 25 of 38 MSAs in positive territory—some with double-digit annual increases—while Philadelphia, Cincinnati, and Austin anchor the bottom.
Retail markets straddle both ends of the spectrum due to wide thresholds: Charlotte, Nashville, Chicago, and other MSAs posted YoY gains above 11%, but a similar number, including some key markets, dipped below -4.7%. For industrial, most MSAs still posted positive YoY growth, but the definition of “Low” is sector-relative. This stabilization reflects a broader shift as industrial markets adjust after rapid rent growth, with investors now focusing on where demand remains durable and supply pressures are easing. Notably, LA and Riverside drops are outliers in a segment accustomed to persistent gains, whereas Sacramento and Denver highlight markets still on the rise.
Why It Matters
For the US CRE industry, having a rent index that controls for space quality, captures concessions, and offers a genuine read on net effective rents is a game-changer amid volatile fundamentals. The CCRI doesn’t just show rents rising or falling; it reveals where and how fast these adjustments occur—and, crucially, whether recent momentum matches or diverges from the underlying longer-term trend. Office’s 9.5% annual gain appears impressive, but aggregate performance masks a cooling pace and a sharp split into outperformers and laggards—per CompStak, more than a third of MSAs posted double-digit YoY jumps, while others face falling effective rents.
Retail’s banded thresholds mean rapid gains in a few MSAs—led by New York, still the country’s deepest retail market—can distort the national average. What stands out is not just the growth but its volatility: with QoQ swings as wide as -6.13% to +7.44%, retail’s recovery is anything but even. Industrial’s story is more nuanced still; per CompStak’s data, even markets classified as ‘Low’ often deliver positive rent growth, underscoring how the relative slowdown in warehouse rents is not always synonymous with absolute declines—unless you’re in LA or Riverside, where both posted outright YoY drops for the first time in years.
What’s Next
CRE investors, lenders, and operators will be watching closely to see if the cooling in office rent momentum turns into a broader pattern or marks a soft landing after two years of post-pandemic volatility. For retail, the challenge is parsing local outperformance from short-term volatility, especially as consumer spending patterns remain unpredictable.
In industrial, expect further divergence between established logistics hubs like Southern California—now repricing downward—and smaller emerging MSAs, where robust demand still pushes net effective rents higher. CompStak’s constant-quality methodology will likely become an industry standard for dissecting these trends as leasing volumes for the remainder of 2026 clarify which trajectories stick and which revert.