






- U.S. industrial leasing hit 202.6M SF in Q3, up 38.5% year over year and the best quarter since 2022, while 71.5M SF of net absorption lifted year-to-date totals past all of 2025.
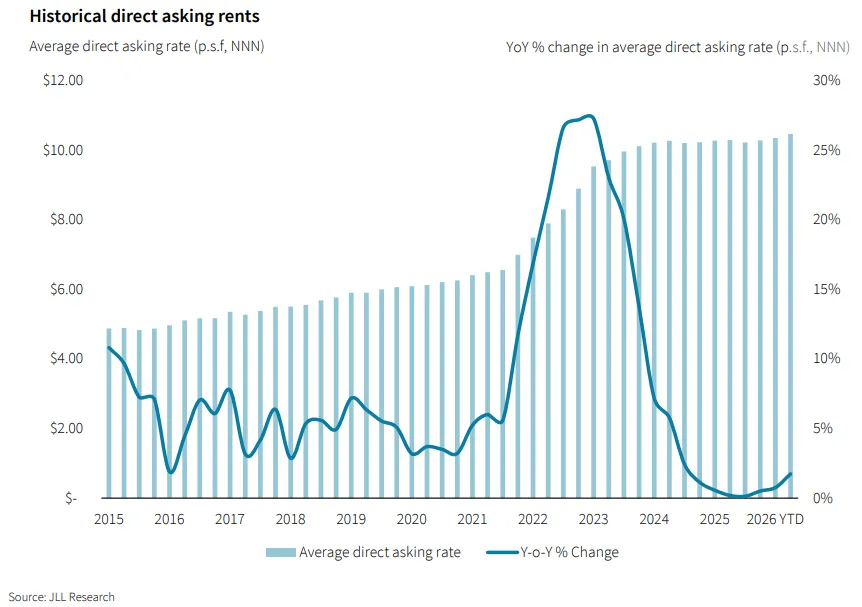
- Vacancy held at 6.8% and asking rents rose 3.2% to $10.55 per SF, with Class A buildings over 1M SF seeing vacancy drop to 5.4% and rents jump 12.1%.
- Developers are answering scarce big blocks with 317M SF under construction, a third of it build-to-suit or owner-user, while diesel at $6.24 a gallon and rate risks cloud 2027.
U.S. industrial leasing reached 202.6M SF in the third quarter, up 38.5% from a year earlier and the strongest quarter since Q3 2022, according to JLL’s Q3 2026 industrial market dynamics report.
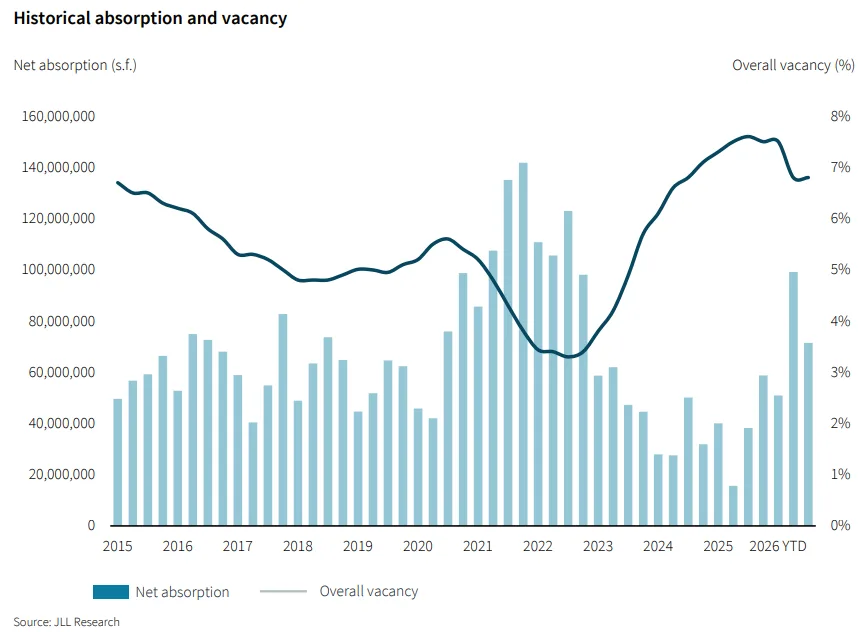
Net absorption of 71.5M SF lifted this year’s total beyond the 151.5M SF recorded across all of 2025, while vacancy held at 6.8%.
Get Smarter about what matters in CRE
Stay ahead of trends in commercial real estate with CRE Daily – the free newsletter delivering everything you need to start your day in just 5-minutes
Leasing Outruns Last Year
Year-to-date leasing totals 523.5M SF, up 35.2% from a year ago and equal to 98.2% of what all of 2025 delivered, JLL says. Quarterly volume rose 15.3% from the second quarter.
Expansions made up 12.6% of volume, versus 7.4% a year earlier the most since early 2021. JLL says tight large-block availability is leading some users to grow in place instead of relocating.
Absorption, Vacancy and Rents
Absorption cooled from 99.2M SF in Q2 but stayed up 86.9% year over year, per JLL. Dallas/Fort Worth alone captured 17.9% of national absorption, and the top five markets, with Houston, Chicago, Atlanta and Phoenix, took 44.2%.
Vacancy sits 80 basis points below a year ago as 60.7M SF of completions roughly matched absorption. Rents on asking terms climbed 3.2%, to $10.55 per SF triple-net, its quickest annual pace since the second quarter of 2024.
Flight to Quality Widens
Vacancy in Class A warehouses dropped to 10.8%, from 12.9% a year ago, and to 5.4% from 9.5% for Class A buildings over 1M SF, JLL reports. Those largest buildings also posted 12.1% rent growth, while buildings of 750,000 to 999,999 SF gained 7.4%.
Older, smaller space is losing ground. Class B recorded a net loss of 0.4M SF of occupancy, and JLL says aging product in Los Angeles, New Jersey, Charlotte, Boston and Eastern and Central Pennsylvania is losing tenants.
Developers Answer Big-Block Scarcity
Construction totals 317M SF, the highest since Q1 2024 and up 14.8% from Q2, per JLL. Class A warehouse construction above 1M SF is up 166.5% year over year, and the count of speculative mega-box projects rose from 18 to 33 in a quarter.
Custom projects built for specific tenants and owner-occupiers total 100.1M SF, or 32.4% of the pipeline, compared with a 26.8% five-year average. Pre-leasing of speculative space is 17.0%, but JLL says it is meaningful only in Chicago (25.6%) and Phoenix (21.5%), so vacancy compression may slow as space delivers.
Colliers research we covered points the same way: the industrial pipeline rebuilds while 2025 and first-half 2026 deliveries are only about 49% occupied.
New Demand Drivers
Data center build-outs are reshaping who leases. Construction materials and building fixtures users took 14.7% of volume, up from 10.8%. Technology and communications occupiers now account for 7.5% versus 4.5% a year earlier, with utilities and energy at 4.6% versus 2.3%, per JLL. It ties the shift to suppliers setting up distribution hubs near hyperscale sites, notably in Dallas/Fort Worth and Metro DC.
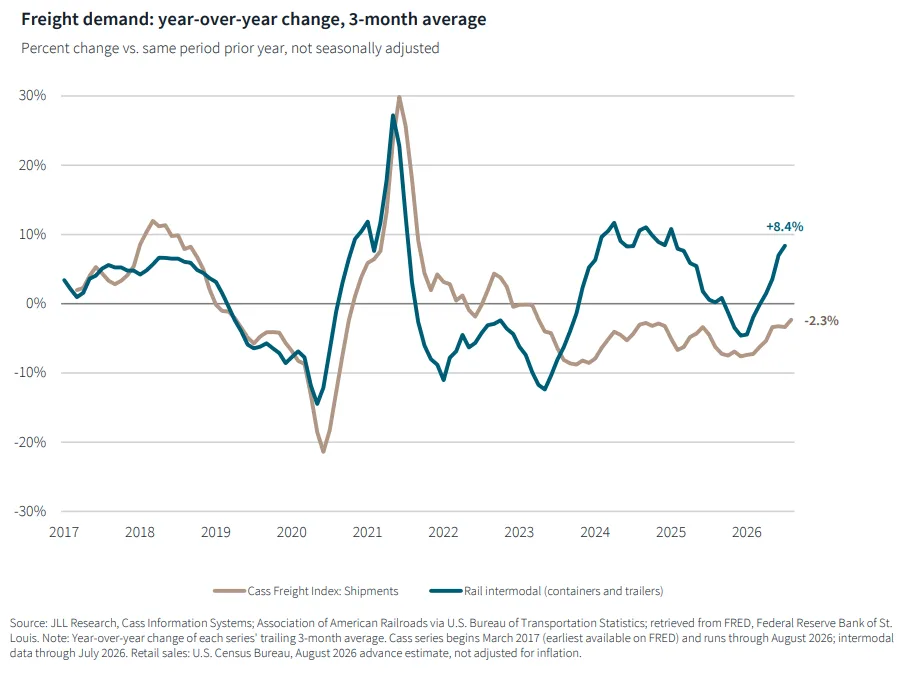
Freight costs are pushing tenants toward flexibility. JLL says diesel costs $6.24 a gallon, 66% more than a year ago, while rail intermodal volume is up 8.4% against a 2.3% decline in overall freight shipments, which is raising interest in rail-served and port-proximate buildings.
Capital Keeps Flowing
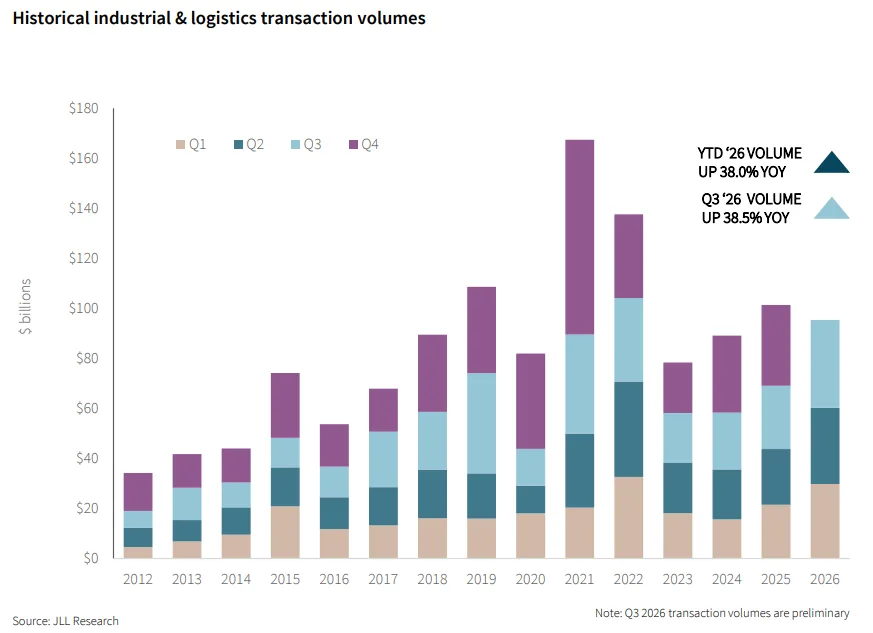
Preliminary year-to-date industrial transaction volume reached $95.3B, up 38% and the second-highest on record, JLL reports. An uptick in 10-year yields late in Q3 is changing deal terms, with some buyers asking for small price tweaks late in the process and penciling in exit cap rates roughly 25 basis points wider.
Why It Matters
JLL projects industrial same-store NOI growth of 5.7% in 2027, second among property sectors, which supports the case for capital rotating into the sector. The gap between big Class A buildings and older small-bay space is the clearest signal for owners deciding where to invest.
The Texas strength shows up locally too. We covered how Houston industrial leasing reached 14.7M SF in Q3, per CBRE, its best quarter in three years.
What’s Next
JLL expects slower deliveries between now and December to support rent growth, especially for Class A buildings that handle automation and heavy power, with rent growth accelerating modestly into 2027. It flags interest rate volatility, fuel costs, trade policy and a possible economic slowdown as the risks to that momentum.