



- Concessions were offered on 15.4% of stabilized units in August, down 0.4 percentage points from July.
- Usage fell in 64% of the 50 largest markets, compared with 48% of the next 100 markets.
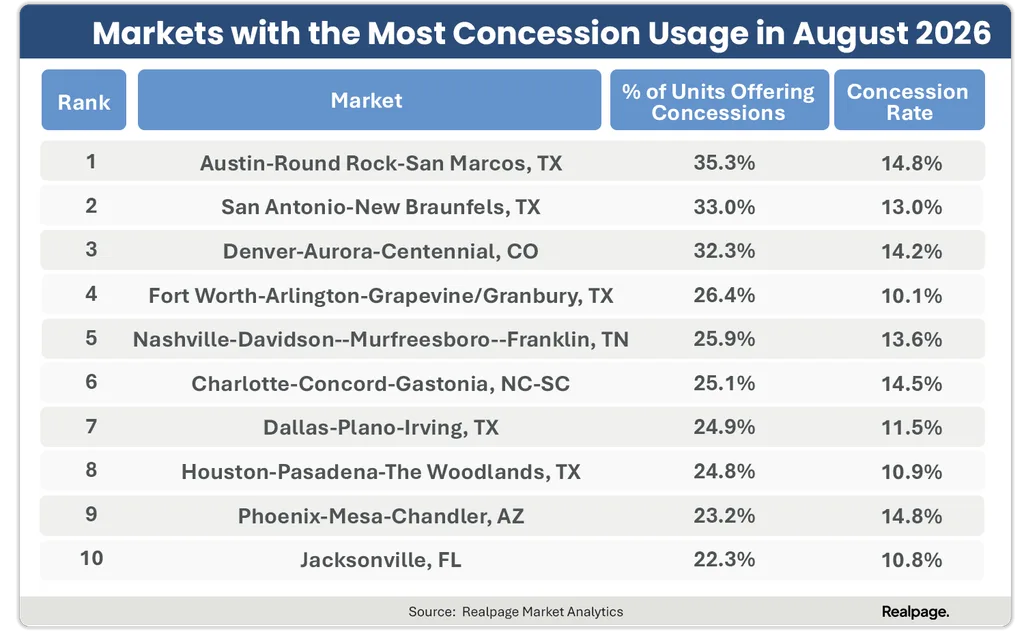
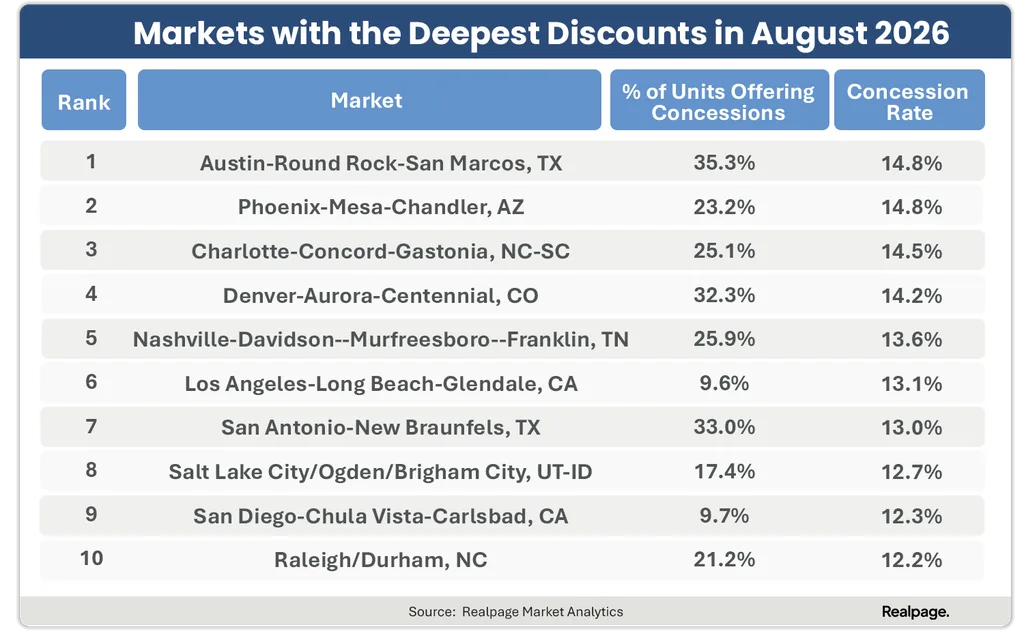
- Austin led major markets with 35.3% concession usage, while Phoenix and Austin offered the deepest average discounts at 14.8%.
Apartment concession use declined across every US region in August, but the pullback was concentrated in larger markets. RealPage Market Analytics reported in its August concession analysis that 15.4% of stabilized units offered incentives. That was down 0.4 percentage points from July. The 50 largest markets drove most of the monthly change. Smaller markets were nearly evenly divided between rising and falling concession use.
Get Smarter about what matters in CRE
Stay ahead of trends in commercial real estate with CRE Daily – the free newsletter delivering everything you need to start your day in just 5-minutes
Large Markets Drive the Pullback
All four regions posted modest declines. The South fell 0.6 points but still had the nation’s highest usage rate at 20.5%. The Northeast and Midwest each declined 0.4 points, reaching 10.7% and 8.6%. The West posted the smallest drop, down 0.2 points to 13.9%.
Among the 50 largest markets, concession use fell in 32, rose in 15 and held steady in three. The average decline among markets that moved lower was 0.47 points. Among the next 100 markets, 48% posted declines, with an average drop of 0.17 points. The entry point for the 10 highest-use large markets also declined. A market needed at least 24.2% concession usage to make that group in July. In August, the threshold fell to 22.3%, and Phoenix returned to the ranking while Las Vegas dropped out.
The Details
Jacksonville recorded the largest drop among the 50 biggest markets at 3.1 points. Salt Lake City fell 3 points and Las Vegas declined 2.9 points. Fort Worth moved in the opposite direction, rising 0.8 points. Nashville increased 0.7 points, Denver added 0.6 points and San Antonio rose 0.4 points.
Concession use remains high in several major markets. Austin led at 35.3% of units, followed by San Antonio at 33% and Denver at 32.3%. Fort Worth, Nashville, Charlotte, Dallas, Houston, Phoenix and Jacksonville also ranked in the top 10. Each had incentives on at least 22.3% of units.
Discount depth did not decline as consistently as usage. The Northeast’s average concession increased 0.3 points to 9.5%. The South rose 0.1 point to 11.6%. The West declined 0.5 points to 11.4%, while the Midwest eased 0.1 point to 8.3%. Smaller-market volatility was much greater. Fort Walton Beach posted an 8.8-point decline to 14.1%. Naples increased 14.8 points to 31.0%. RealPage noted that Naples has averaged monthly swings of about 5 points during the past two years, which tempers the significance of its August jump.
Why It Matters
The gap between usage and discount depth shows operators are changing how often they use incentives faster than how deeply they discount. Apartment concessions are becoming more selective across markets rather than disappearing uniformly. Among the 150 largest markets, 47% offered smaller discounts than in July. Only 24% eased on both concession usage and discount size.
Phoenix and Austin tied for the deepest average discounts among the 50 largest markets at 14.8%. Charlotte followed at 14.5%, Denver at 14.2% and Nashville at 13.6%. Los Angeles and San Diego offered discounts around 12% to 13%, even though only about 9.5% of units used concessions. Looking across the 150 largest markets changes the discount leaders. Naples ranked first at 17.6%, followed by Fort Myers at 16.9% and Bakersfield at 16.7%. Sarasota reached 15.8% and Huntsville 15%. Bakersfield is a special case because concessions applied to only 0.3% of units. The deep average discount therefore affected very few apartments.
What’s Next
RealPage described August as a modest and uneven decline rather than a broad reset. A stronger shift would require smaller markets to follow the largest markets. Discount depth would also need to fall alongside usage. For now, operators are reducing incentive frequency in many major markets while maintaining meaningful discounts where concessions remain necessary to secure leases.
The data also suggest that regional averages alone are not enough to judge leasing pressure. Every region moved lower on usage, yet individual metros moved sharply in both directions. Owners will need to track local concession frequency and discount depth separately.