




- CoStar’s value-weighted property index fell 1.3% in August, extending its losing streak to five months.
- The equal-weighted index rose 1.4% and finished just 0.5% below its March record.
- Repeat-sale volume fell year over year, while office and retail deals produced the largest aggregate value losses.
Commercial property pricing moved in opposite directions in August. CoStar reported that its index for larger transactions fell 1.3%, while its equal-weighted measure rose 1.4%. The latest repeat-sales data show a widening gap between institutional-grade assets and smaller properties. The value-weighted index has now declined for five straight months. By contrast, the equal-weighted index recorded its first monthly increase since March. That measure finished August just below its all-time high.
Get Smarter about what matters in CRE
Stay ahead of trends in commercial real estate with CRE Daily – the free newsletter delivering everything you need to start your day in just 5-minutes
Large Assets Extend Their Slide
The value-weighted US Composite Index fell 4% over the previous three months. It also stood 1.4% below August 2025 and 19.4% below its July 2022 record. Because expensive transactions carry more influence in that index, it closely reflects larger assets in major investment markets. CoStar said prices remained weak across large office, apartment, retail and industrial sales. Smaller properties in secondary and tertiary markets moved in the other direction.
The equal-weighted index gained 1.2% over the quarter and 2.2% over the year ended in August. August transaction activity also weakened from the prior year. That makes the divergence more notable because smaller-asset prices improved despite fewer repeat sales overall. CoStar capital-markets analytics director Chad Littell said supply pressure is easing while demand in the general commercial segment improves. He described the market as moving toward better balance after a difficult stretch.
The Details
CoStar based its August readings on 1,534 properties that had sold at least twice. Its broader database contains more than 353,501 repeat sales since 1996. August repeat-sale transaction count fell 8.6% from a year earlier. Those deals generated $11.3B in volume, down 10.3% year over year.
Office deals posted the largest aggregate decline from prior sale values. The 265 office repeat sales produced a combined loss of $324.5M. Retail also finished negative. Its 455 repeat sales generated a combined $42.4M loss.
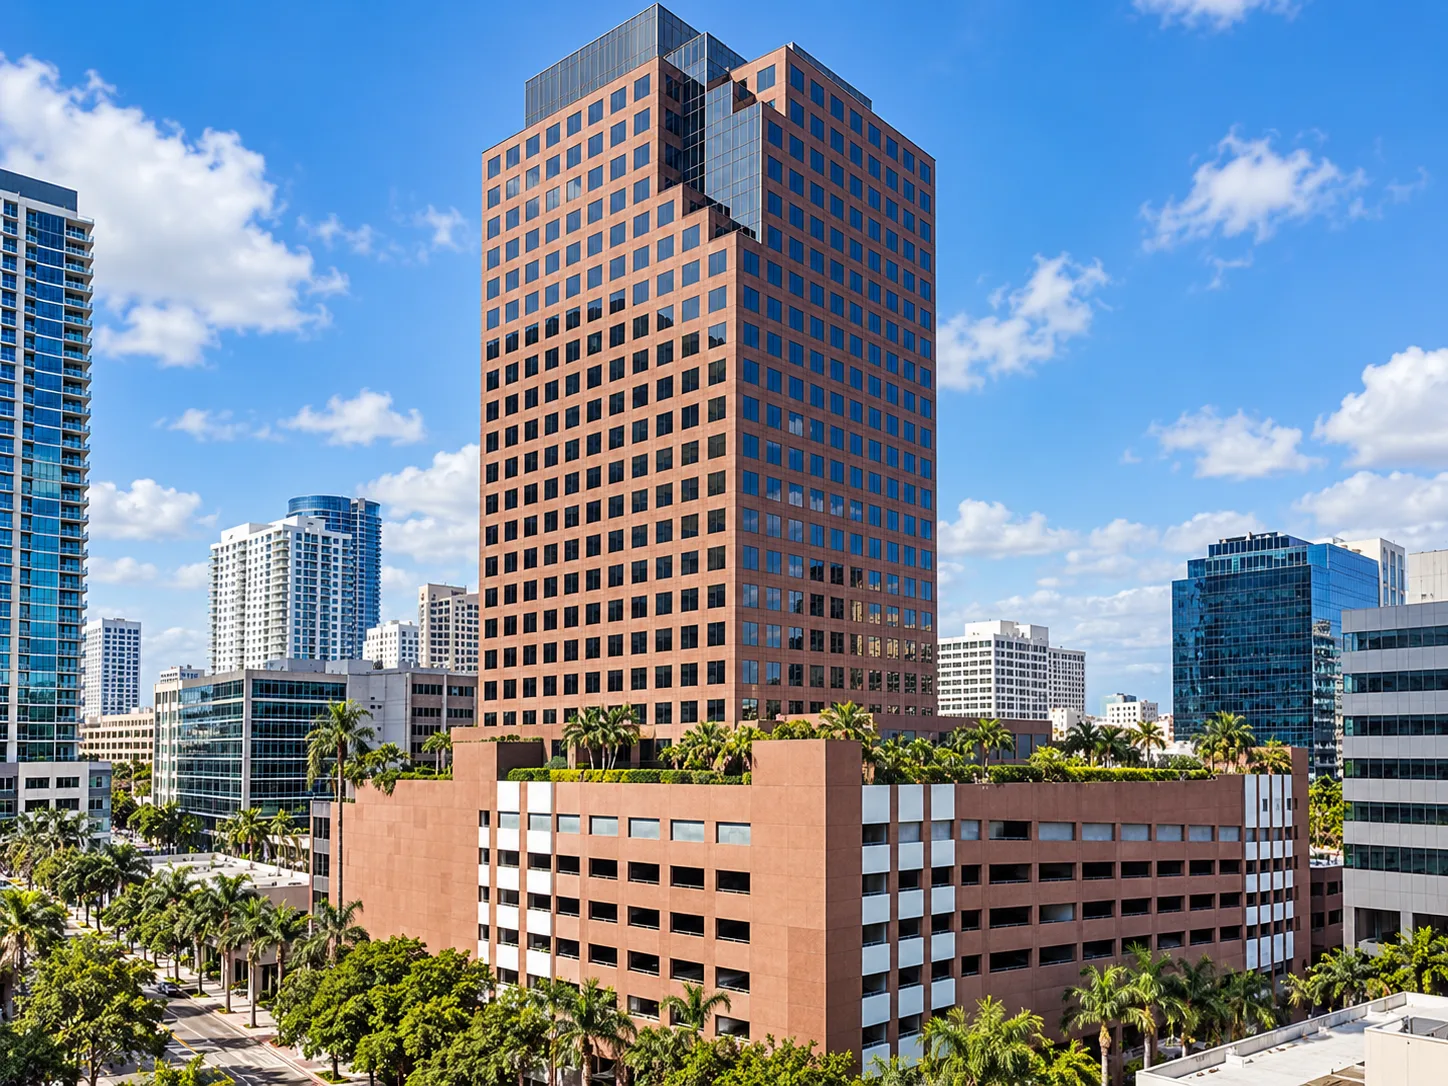
Two transactions show the scale of the reset. The University of Colorado system bought Denver’s 25-story Independence Plaza for $27.95M. That price was $116.6M below the building’s 2007 trade. Providence Place Mall sold for $133M, or $377M below its 2004 sale price. The 1.4M SF mall had also gone through a prolonged CMBS workout.
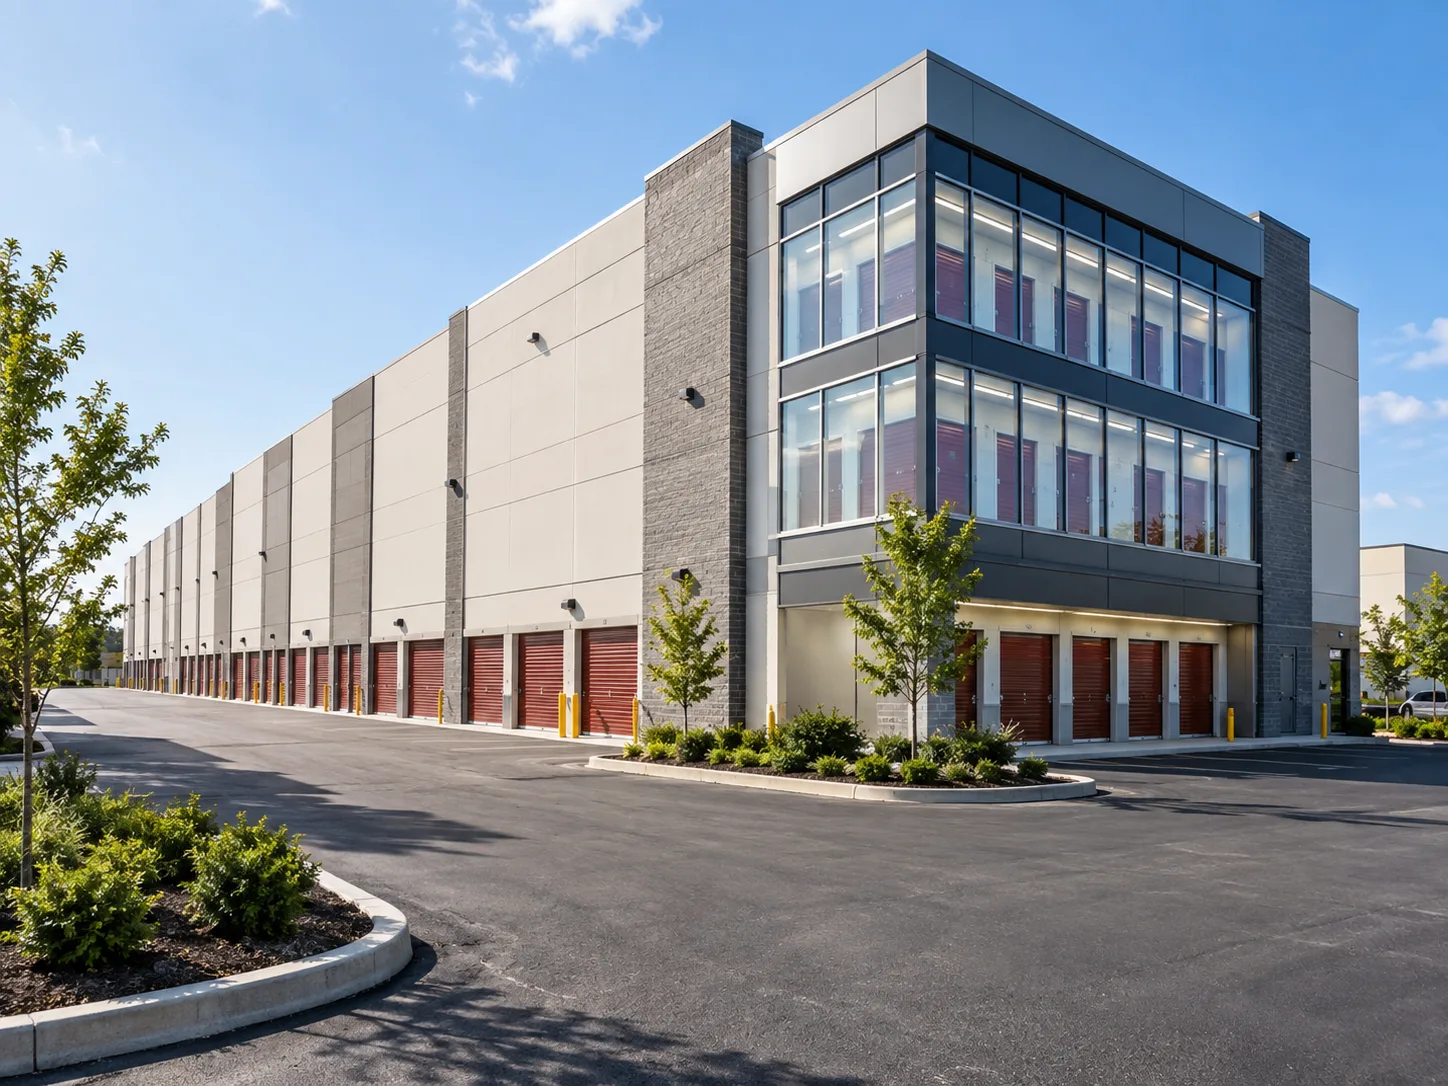
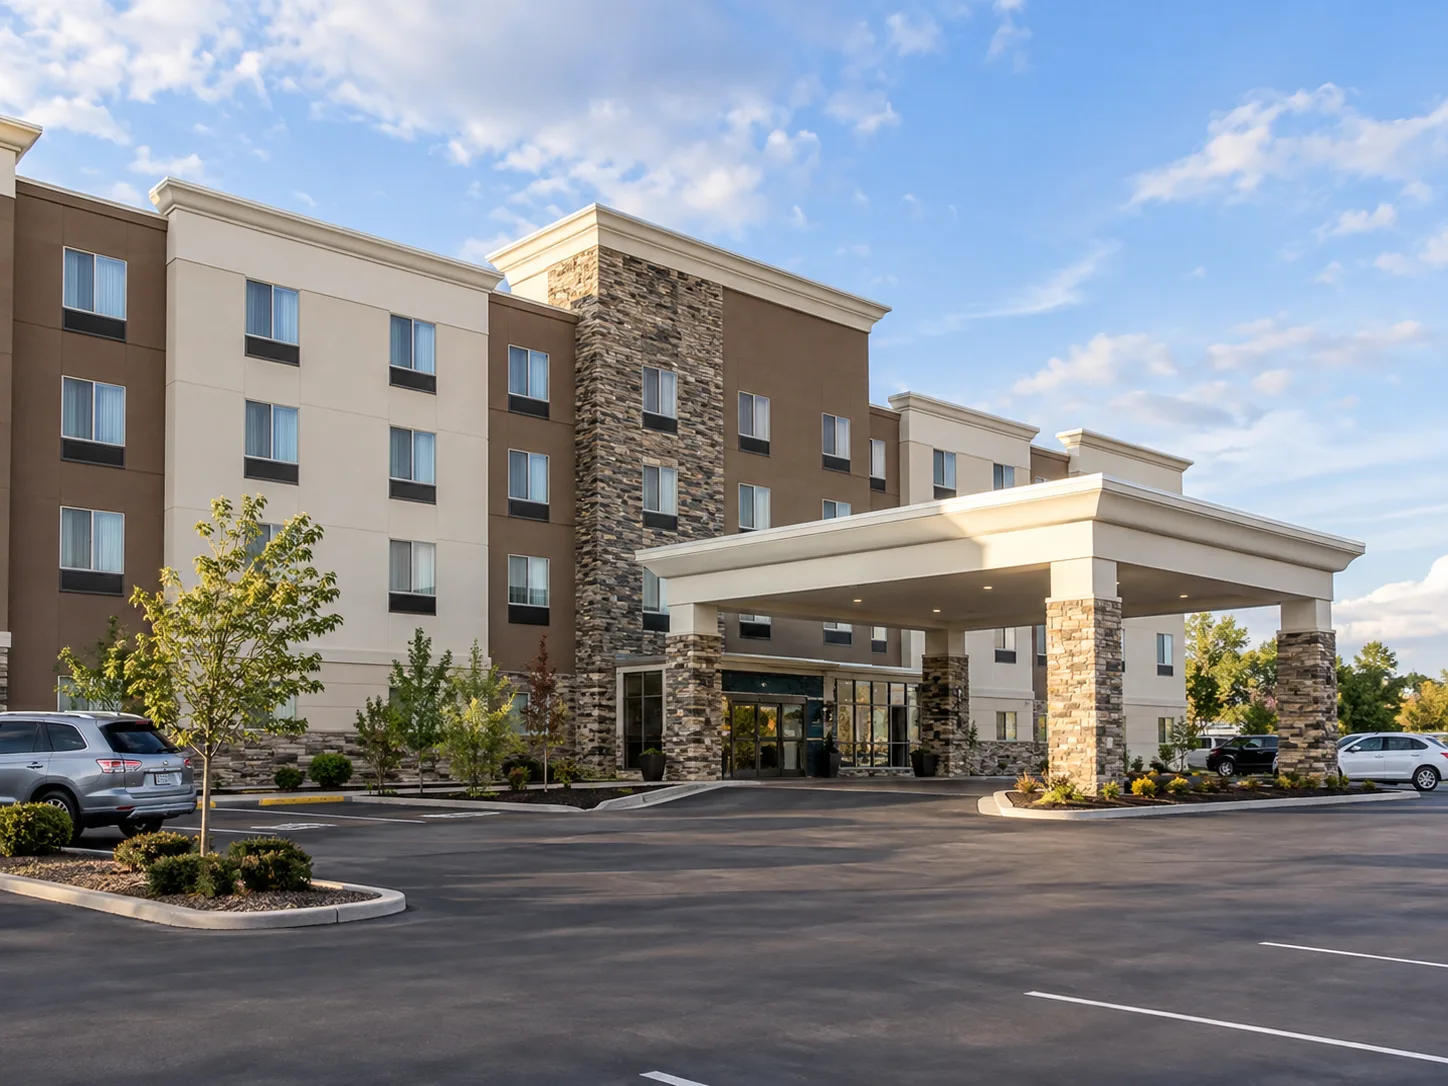
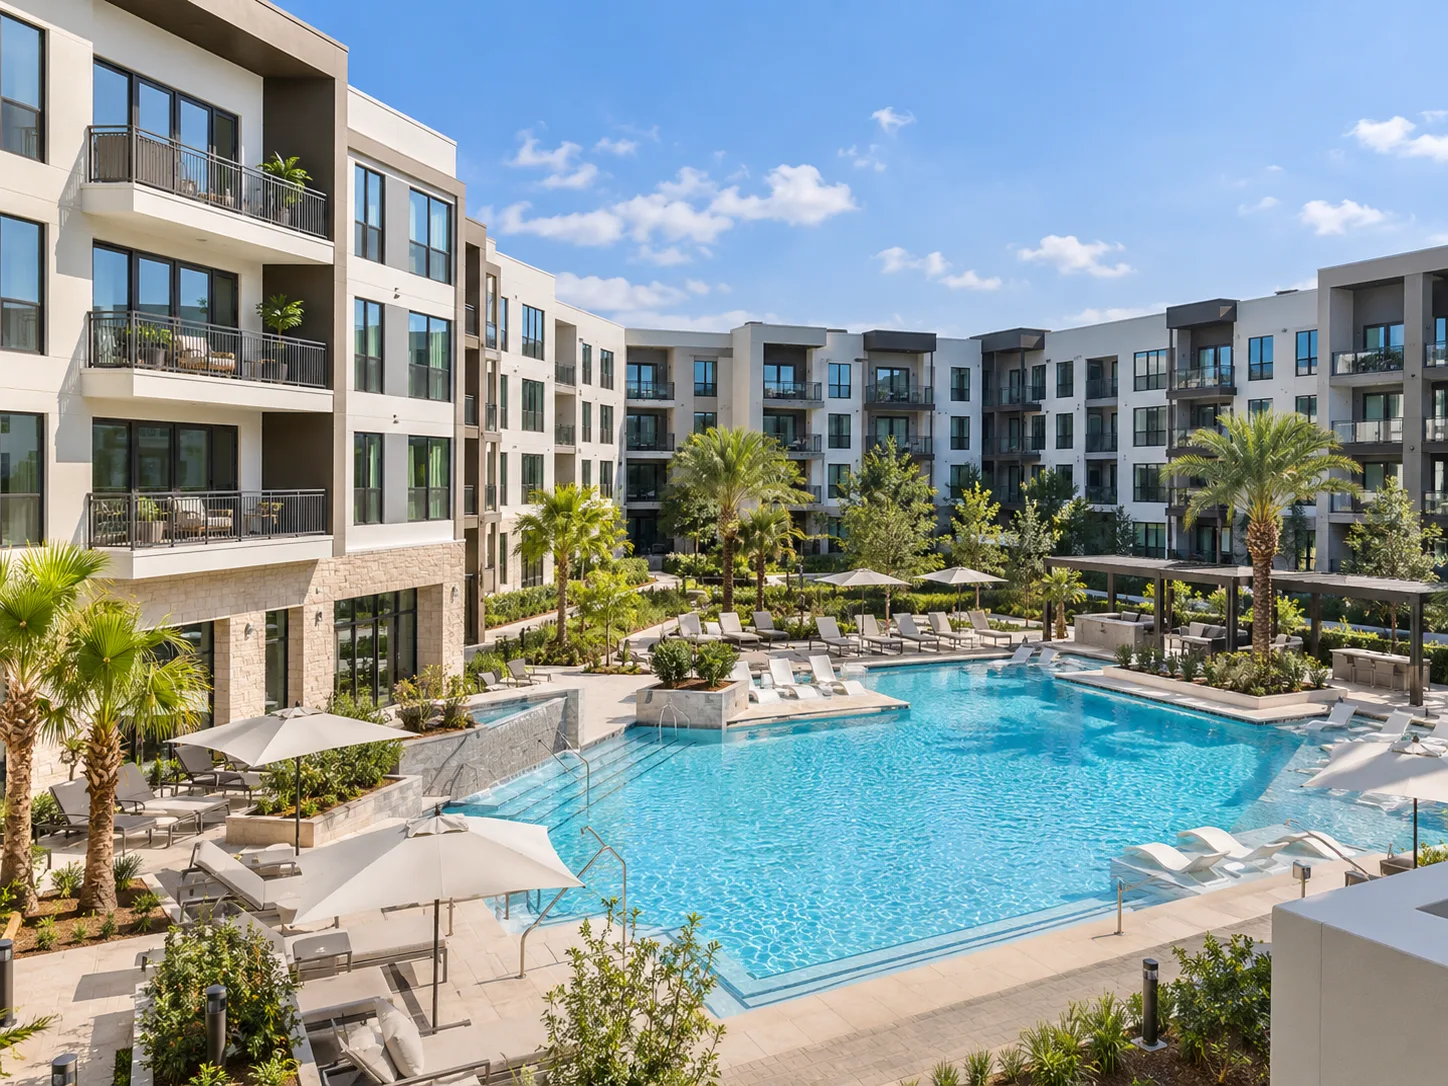
Other sectors generated aggregate gains. Industrial repeat sales added about $825.9M across 391 properties. Multifamily gained about $349.8M across 231 transactions. Hospitality added roughly $92M across 48 sales.
Why It Matters
The latest split shows that a broad pricing recovery has not reached every segment. Investors appear more willing to support smaller, lower-priced assets than large properties. Commercial property pricing remains uneven across transaction sizes, even as some sectors post aggregate gains. Lower transaction counts also show that better pricing in one part of the market has not translated into stronger August activity.
Supply pressure is easing at the same time. Office, retail and industrial completions were projected at 482M SF for the 12 months ended in September. That would be 19.5% below the prior year. Quarterly completions were also projected to fall 63% from their fourth-quarter 2023 cyclical peak. The sector results also show that large-property weakness is not uniform across every asset type. Industrial and multifamily repeat sales still generated aggregate gains in August. Office and retail, however, showed significant losses versus their prior trade values. That contrast helps explain why a single national index can mask very different outcomes.
What’s Next
Demand still looks mixed. Investment-grade properties were expected to return 8.1M SF to the market. Tenants in the general commercial segment were projected to increase occupancy by 5.3M SF. CoStar’s August data therefore points to a market with less new supply but sharply different pricing outcomes.
Future readings will show whether the smaller-asset recovery broadens into larger deals or remains concentrated below the institutional end of the market. The equal-weighted benchmark is already only 0.5% below its March record. The value-weighted index remains almost one-fifth below its 2022 peak. Closing that gap would require stronger pricing for the larger properties that dominate institutional transaction volume.