



- August retail sales increased 5.3% year over year and core retail rose 4.9%, according to Colliers data citing GlobalData and Placer.ai.
- Theaters and music venues posted a 58.3% traffic increase, while hobbies, gifts, and crafts rose 20.1%.
- Grocery sales declined 0.5% and traffic was nearly flat, showing a more cautious pattern in essential spending.
Colliers reports in its August retail sales and traffic update that retail foot traffic split sharply by category while spending stayed resilient. Retail sales rose 5.3% year over year and core retail increased 4.9%. Colliers cited GlobalData and Placer.ai for the underlying data.
Inflation still drove much of the dollar growth, but overall retail volumes increased 1.7%. Higher gas prices alone added 0.8 percentage points to retail growth, creating additional pressure on household budgets even as consumers continued spending.
Get Smarter about what matters in CRE
Stay ahead of trends in commercial real estate with CRE Daily – the free newsletter delivering everything you need to start your day in just 5-minutes
Retail Foot Traffic Details
Higher gas prices left households with less room for discretionary purchases. Apparel sales still increased 3.5%, although underlying volumes rose only 0.6%, pointing to inflation accounting for much of the nominal gain.
Clothing foot traffic increased 3.6%, closely matching sales growth, while department store visits rose 5.3%. Discount and dollar store traffic increased 2.9%, and superstore visits rose 1.3%. Drugstore and pharmacy traffic also increased 1.1%.
The pattern suggests shoppers remained active but became more selective about where they spent. Traffic gains were concentrated in certain value-oriented and discretionary categories rather than spread evenly across retail.
Big-Ticket Spending Holds Up
Electronics sales jumped 7.9% and home improvement rose 5.2%, while furniture and furnishings increased just 0.8%. Visits moved much less. Electronics traffic rose 0.9%, home improvement increased 1.8%, and furniture and home furnishings gained 1.5%, according to Placer.ai data included by Colliers.
That gap indicates consumers were still committing to larger purchases despite making fewer shopping trips. Retail sales and foot traffic have been diverging under inflation pressure across several recent monthly readings.
For landlords, sales strength alone does not reveal how frequently shoppers are visiting a property. Categories generating strong dollar growth may produce much smaller increases in physical traffic, creating different implications for neighboring tenants and shopping center activity.
Experiences Take the Lead
Experience and hobby categories recorded some of the strongest traffic gains. Theaters and music venues surged 58.3%, attractions rose 29.8%, and hobbies, gifts, and crafts increased 20.1%. Fitness traffic climbed 7.3%.
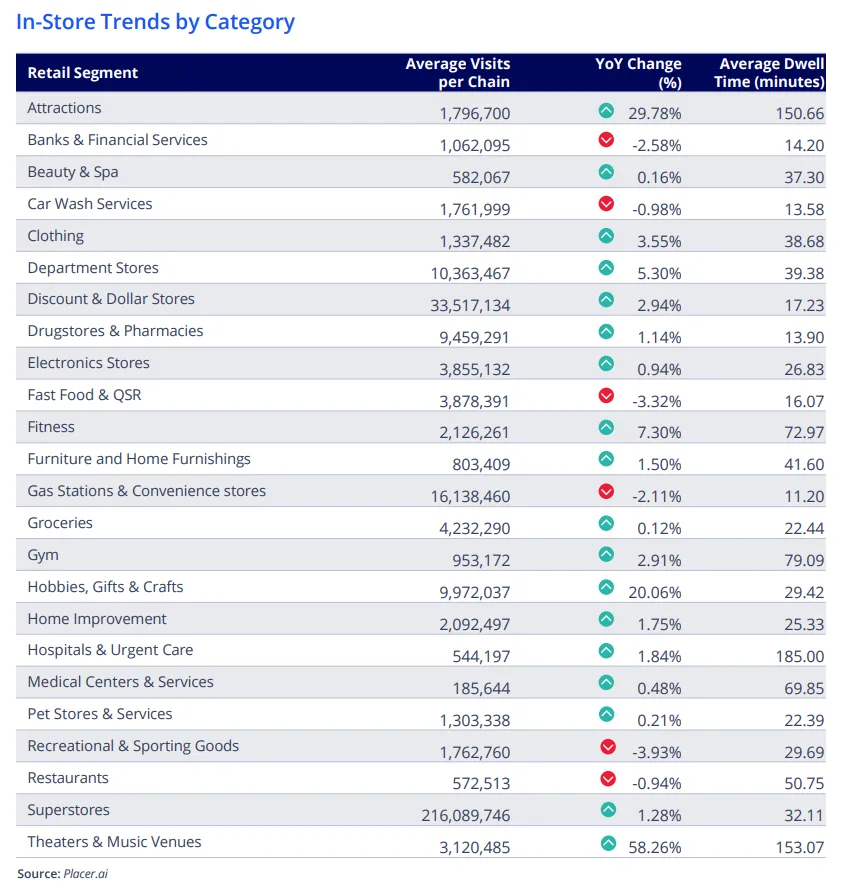
Sporting and hobby store sales also rose 9.4%, supported by back-to-school demand and lingering World Cup interest. However, recreational and sporting goods traffic declined 3.9%, highlighting another gap between spending and visits.
AMC Theatres led Colliers’ top-performing chains with a 69.9% year-over-year traffic gain, followed by Regal Cinemas at 61.8%. Crunch Fitness rose 17.2%, Five Below 16.6%, Ross 13.8%, and Trader Joe’s 10.1%. Hobby Lobby gained 9.3%, while Equinox and Planet Fitness increased 8.4% and 8.3%, respectively.
Why It Matters
Essential spending looked more cautious. Grocery sales fell 0.5%, while grocery traffic was nearly flat at 0.12%. Fast-food and quick-service restaurant traffic declined 3.3%, restaurant visits fell 0.9%, and gas station and convenience-store traffic dropped 2.1%.
For retail landlords, the category split matters because nominal sales growth does not translate evenly into visits. Experience-led uses generated strong traffic, while several essential categories showed little growth or declines.
The divergence also reinforces the importance of tenant mix. Properties with entertainment, fitness, value retail, and other high-traffic uses may see very different visitation trends from centers more dependent on categories where consumers are consolidating trips.