



- National multifamily rents rose 2.2% year-over-year in August, up from 1.9% in July and 1.5% in June.
- About 74.6% of US metros posted monthly rent gains, the highest share since March 2023, while 91.1% grew year-over-year.
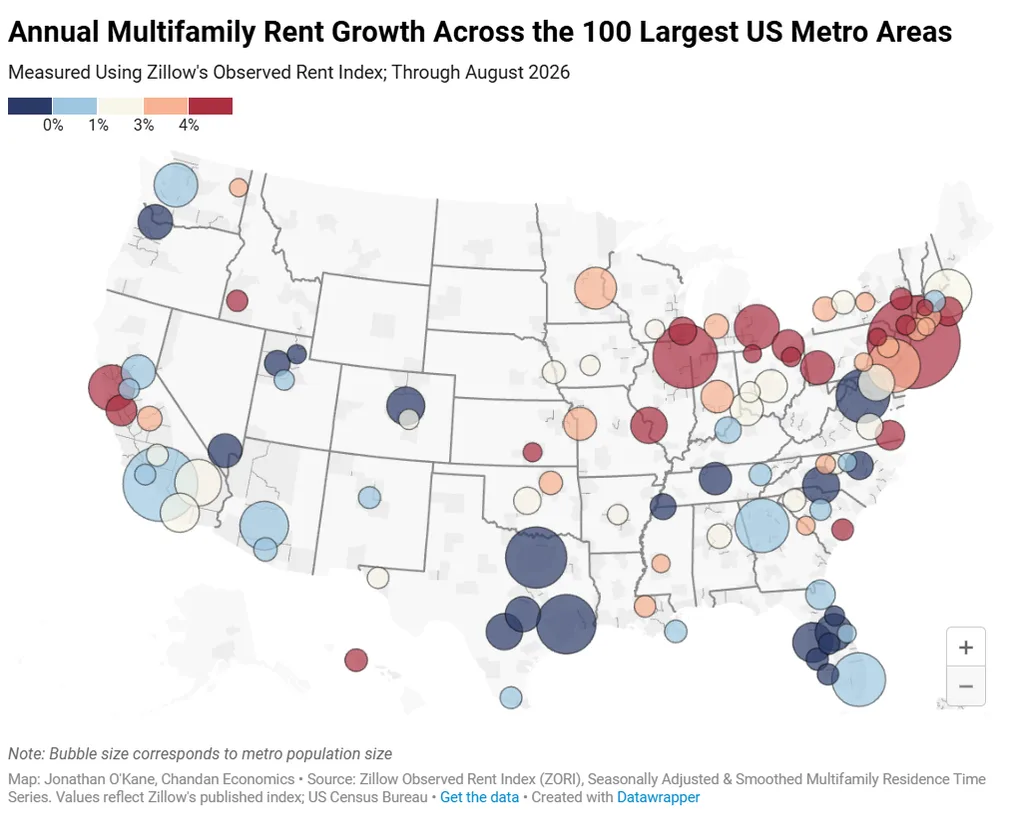
- San Francisco led annual growth at 11.7%, but many Sun Belt laggards with negative annual readings posted positive monthly growth.
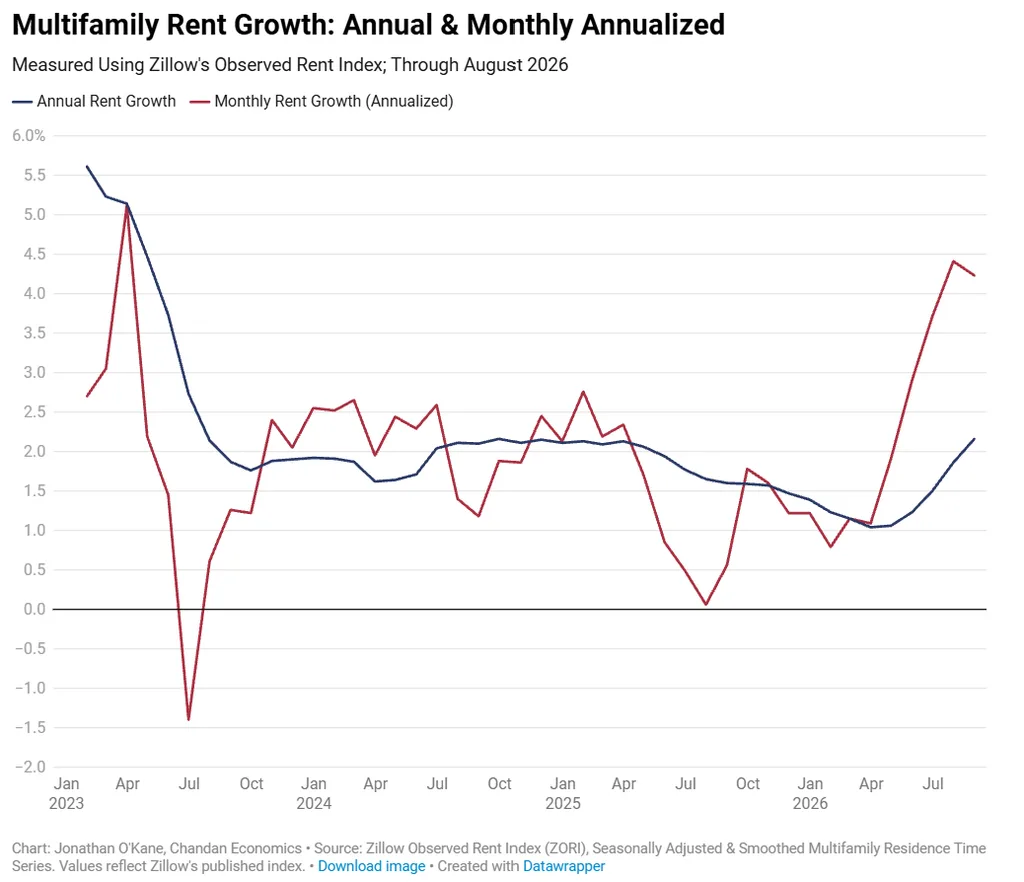
Chandan Economics says the US rental market strengthened again in August. Multifamily rent growth accelerated and spread across more metros. Its September multifamily rent analysis, based on the Zillow Observed Rent Index, shows national rents up 2.2% year-over-year. Growth was 1.9% in July and 1.5% in June. Annual growth has now accelerated for five consecutive months since its March low.
The improvement provides further evidence that the rental market has moved beyond the stabilization phase seen at the start of 2026. National growth remains moderate compared with earlier periods. However, stronger monthly momentum is increasingly filtering into annual rent figures.
Get Smarter about what matters in CRE
Stay ahead of trends in commercial real estate with CRE Daily – the free newsletter delivering everything you need to start your day in just 5-minutes
Momentum Broadens Beyond the National Average
Short-term growth remained strong despite a slight easing from July. Annualized month-over-month rent growth was 4.2% in August. It was 4.4% one month earlier. That pace remains near its strongest level since early 2023.
The breadth of the increase was more notable. About 74.6% of US metros recorded monthly gains, the highest share since March 2023. The share has increased or held roughly steady every month since February.
Meanwhile, 91.1% posted year-over-year growth, up from 89.1% in July. That was the highest share since December 2024. Together, the monthly and annual figures point to a recovery that is becoming less dependent on a small group of outperforming markets.
The Details
San Francisco led the 100 largest metros with 11.7% annual rent growth. San Jose followed at 8.0%. Virginia Beach reached 7.3%, Boise 6.9%, and Toledo 6.6%. The leaders span the West, Midwest, and East Coast, highlighting the geographic breadth of current rent growth.
The weakest annual readings remained concentrated in markets that faced heavier supply pressure earlier in the cycle. North Port fell 2.6%, San Antonio 2.5%, and Cape Coral 2.1%. Denver declined 1.5%, while Tampa fell 0.9%.
Only 16 of the 100 largest metros still had year-over-year declines. Fourteen of those 16 posted positive monthly growth in August. That divergence suggests annual figures are increasingly capturing earlier weakness rather than current conditions in many markets.
Former Laggards Start to Improve
The current data show why trailing annual numbers can understate a market turn. Austin, Tampa, Denver, Dallas, and Houston remained negative year-over-year but posted positive monthly momentum. Nashville, Orlando, North Port, San Antonio, and Cape Coral showed the same pattern.
Chandan cautioned that this does not guarantee an immediate recovery in every laggard. Still, the weakest annual readings increasingly reflect earlier softness rather than fresh deterioration. The shift is particularly notable in markets that absorbed significant new apartment supply earlier in the cycle.
Monthly performance also broadened beyond a few leaders. Twenty large metros posted gains above 0.5% in August. That translates to an annualized pace above 6% if sustained. Those metros were spread across multiple regions rather than concentrated in a single geographic cluster.
Why It Matters
Northern California, the Midwest, and much of the Northeast still lead the broader geographic pattern. However, stronger momentum is now spreading into markets that remain weak on a trailing basis. That breadth aligns with the widening geographic spread of the multifamily rent recovery.
The distinction between current momentum and trailing annual performance is becoming increasingly important. Markets with negative annual growth can still be entering an improving phase as recent monthly gains replace earlier declines.
That shift also points to improving supply-demand conditions. The post-pandemic delivery wave is gradually being absorbed, reducing some of the pressure that weighed on rents in high-supply metros. As that adjustment progresses, rent growth is becoming more broadly distributed across the country.
Monthly Leaders Show Wider Participation
Short-term leaders were not limited to one region. San Francisco gained 1.6% during August, and San Jose rose 1.0%. Boise and Virginia Beach each increased 0.9%, while Scranton gained 0.8%.
The weakest monthly markets were Provo and Little Rock, both down 0.4%. Urban Honolulu and Omaha declined 0.2%, and Worcester fell 0.1%. The spread shows that stronger momentum is reaching a wider set of metros even as some markets still soften.
Overall, 20 of the 100 largest metros recorded monthly gains above 0.5%. Combined with nearly three-quarters of US metros posting increases, the data suggest the national acceleration is being supported by wider market participation rather than a few outsized gains.
What’s Next
Chandan describes the market as a broader reacceleration rather than a return to unusually high growth. Annual rent growth has now strengthened for five consecutive months. Nearly three-quarters of metros are posting monthly gains, while more than nine in 10 have rents above year-ago levels.
The post-pandemic supply wave is gradually being absorbed. That is helping supply-demand conditions move toward better balance. Elevated mortgage rates also support rental demand at the margin by making homeownership less attainable for some households.
Stronger operating fundamentals are developing against a difficult capital-markets backdrop. Higher required returns continue to pressure apartment valuations, even as rent fundamentals improve. That creates a split between strengthening property-level performance and financing conditions that remain restrictive.
For rent performance, the key signal is participation. More markets are contributing to growth, while many former laggards are showing improvement before it appears in annual figures. The direction of the rental market is increasingly defined by stronger growth, broader participation, and improving momentum across previously weak metros.