



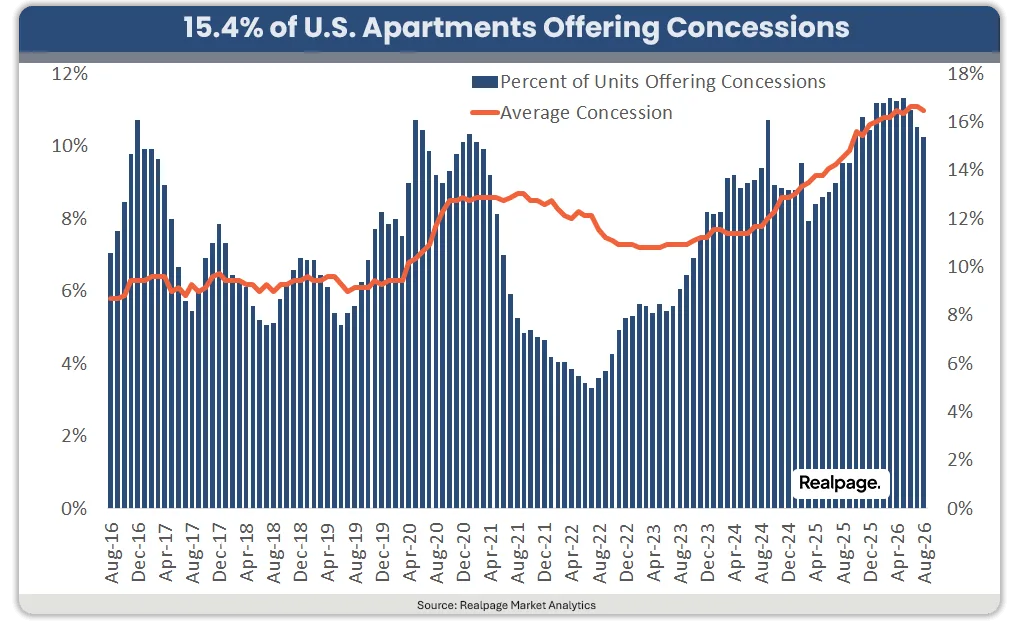
- Concessions were offered on 15.4% of stabilized US apartment units in August, down 0.4 percentage points from July.
- The average concession slipped to 11% of asking rent, equal to about 5.7 weeks free on a 12-month lease.
- Annual completions near 340,000 units still exceeded absorption above 270,000 in Q2 2026, limiting operators’ ability to pull incentives back.
Apartment operators reduced the reach of concessions for a third straight month in August, but discount depth barely changed. RealPage Market Analytics says 15.4% of stabilized US units offered concessions during the month, down 0.4 percentage points from July. The average discount slipped to 11% of asking rent from 11.1% in both June and July. The pattern suggests operators are reducing the number of units with incentives before materially shrinking incentive value.
Get Smarter about what matters in CRE
Stay ahead of trends in commercial real estate with CRE Daily – the free newsletter delivering everything you need to start your day in just 5-minutes
Discount Reach Shrinks
Concession use peaked at 17% in both March and May before moving lower in June. Even after three months of narrowing, usage remained 1.1 percentage points above the 14.3% rate recorded in August 2025. Discount depth also stayed elevated. The 11% average was 1.3 points above the year-earlier level and only 0.1 points below the deepest reading in RealPage’s history back to 2010.
The Details
At 11% of asking rent, the typical concession equals about 5.7 weeks free on a 12-month lease. That resembles March 2010 on discount depth, but not on reach. Operators offered concessions on 50% of stabilized units then, compared with 15.4% now. The current pattern is narrower and deeper, echoing earlier apartment concession pressure without matching the post-financial-crisis breadth.
Class C Still Leads Incentive Use
Usage declined across every product class in August. Class C fell 0.9 points to 19.7%, its lowest level since December 2025. Class A declined 0.4 points to 12.9%, while Class B slipped 0.3 points to 13.7%. The average discount varied less, ranging from 10.6% for Class B to 11.3% for Class A. Efficiency units remained the most heavily discounted floorplan, with 17.7% usage and a 12.1% average discount.
Why It Matters
The easing came without a major demand surge. Occupancy averaged 95.5% in August, while same-store effective rents rose 0.9% year over year. At the same time, annual completions of about 340,000 units continued to exceed annual absorption above 270,000 units in Q2 2026. That imbalance keeps pressure on operators in delivery-heavy markets. National concession use can therefore decline even while the units still receiving incentives require deep discounts.
What’s Next
Two signals will show whether August marked a durable turn. First, the average discount would need to follow concession usage lower after peak leasing season. That would indicate operators are actually shrinking incentive value. Second, the supply gap must keep closing. Annual completions are declining, but they still exceed absorption. Until that changes, the heaviest delivery markets have limited room to reduce incentives, and national averages will continue reflecting that pressure.