







- The AP Top 25 football campuses are within five miles of 314 student housing properties backing $6.1B of securitized mortgages.
- Top academic universities have $3.4B of nearby securitized student housing debt, and seven campuses have no exposure.
- Football-campus loans show slightly stronger occupancy, debt-service coverage, and non-performing rates than the academic group.
Student housing debt is far more concentrated around major college football programs than around the most selective universities. Trepp analyzed securitized student housing loans near both groups. It found $6.1B of mortgages within five miles of the AP Top 25 football campuses. The comparable balance near the US News 2026 Top 25 national universities is $3.4B.
Get Smarter about what matters in CRE
Stay ahead of trends in commercial real estate with CRE Daily – the free newsletter delivering everything you need to start your day in just 5-minutes
Student Housing Debt Clusters Around Football
The football-campus group includes 314 properties, and all 25 ranked schools have nearby student housing backing securitized loans. Seven universities in the academic Top 25 have no such exposure. Together, the two groups account for $9.5B of the broader $29.3B securitized student housing market.
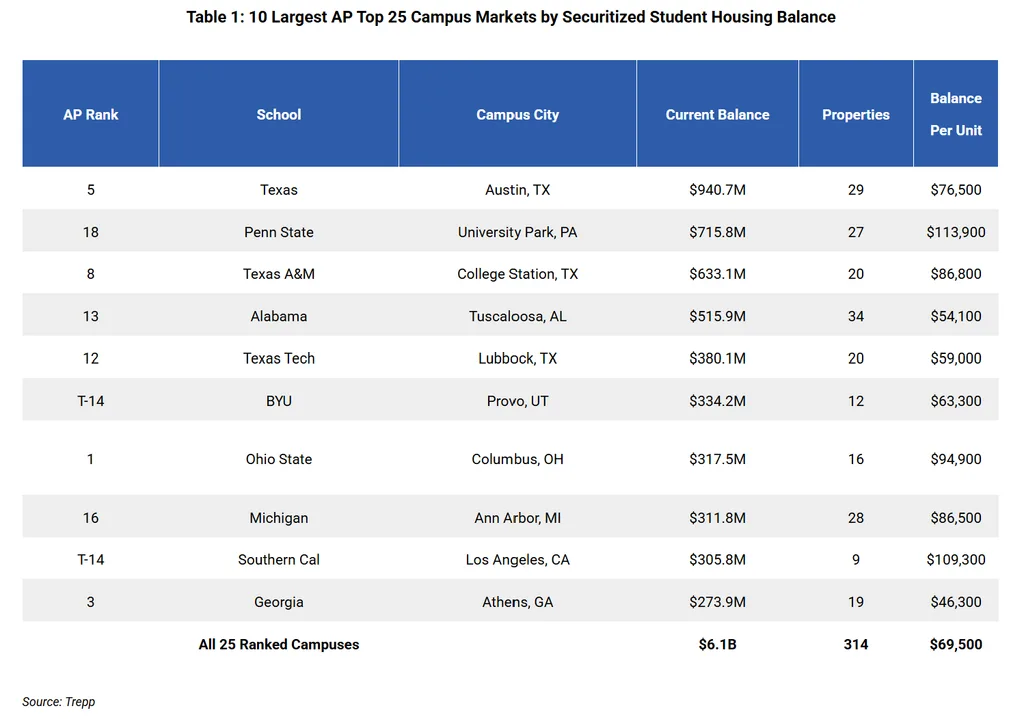
Texas leads the football group with $940.7M across 29 properties near its Austin campus. Penn State follows at $715.8M across 27 properties. Texas A&M has $633.1M across 20 properties, while Alabama has $515.9M across 34.
Texas Tech accounts for $380.1M across 20 properties, followed by BYU at $334.2M across 12. Ohio State has $317.5M across 16 properties. Michigan, Southern Cal, and Georgia round out Trepp’s 10 largest football-campus markets by securitized balance.
Trepp said football itself does not explain the lending concentration. Many top programs sit at large universities in college towns that also support purpose-built student housing at scale.
The largest campus markets show a wide range of debt per unit. Penn State carries $113,900 per unit, Southern Cal $109,300, and Ohio State $94,900. Georgia is lower at $46,300 per unit, while Alabama is at $54,100 and Texas Tech is at $59,000.
Collateral Profiles Diverge
Debt per unit near the AP campuses averages $69,500. That is almost identical to the broader student housing market’s $69,400 per unit. The academic Top 25 averages $121,400 per unit, reflecting a smaller set of higher-cost properties.
The comparison also reflects differences in local housing supply. Princeton, Stanford, Yale, Caltech, Brown, Vanderbilt, and Georgetown have no nearby properties backing securitized student housing loans. Trepp said these campuses often have limited land and high on-campus housing shares. Nearby rentals may also be scarce, expensive, or financed as conventional multifamily.
The academic campuses therefore combine less total securitized exposure with more debt attached to each unit. The football group looks much closer to the wider purpose-built student housing market on a per-unit basis. That difference helps explain why Trepp described the two groups as distinct collateral profiles rather than simply different university rankings.
Loan Performance Remains Stable
Neither group is distressed, according to Trepp. Balance-weighted occupancy is 91.5% near the AP campuses, compared with 89.9% around the academic Top 25. Median net cash flow debt-service coverage is 1.68x versus 1.61x.
The non-performing rate is 0.6% near the football campuses and 0.9% for the academic group. Those figures show how student housing market fundamentals can vary with campus type and collateral profile.
Why It Matters
The AP football poll is a stronger map of where securitized student housing has developed at scale. Every ranked football campus has nearby exposure. Debt per unit there closely matches the wider market. The academic list represents a smaller, higher-cost property set, and seven campuses sit outside the securitized market entirely.
The $6.1B football-campus balance is nearly twice the academic group’s exposure. Yet performance remains healthy in both sets. The difference is mainly one of concentration, property economics, and how student housing is financed around each type of university.