









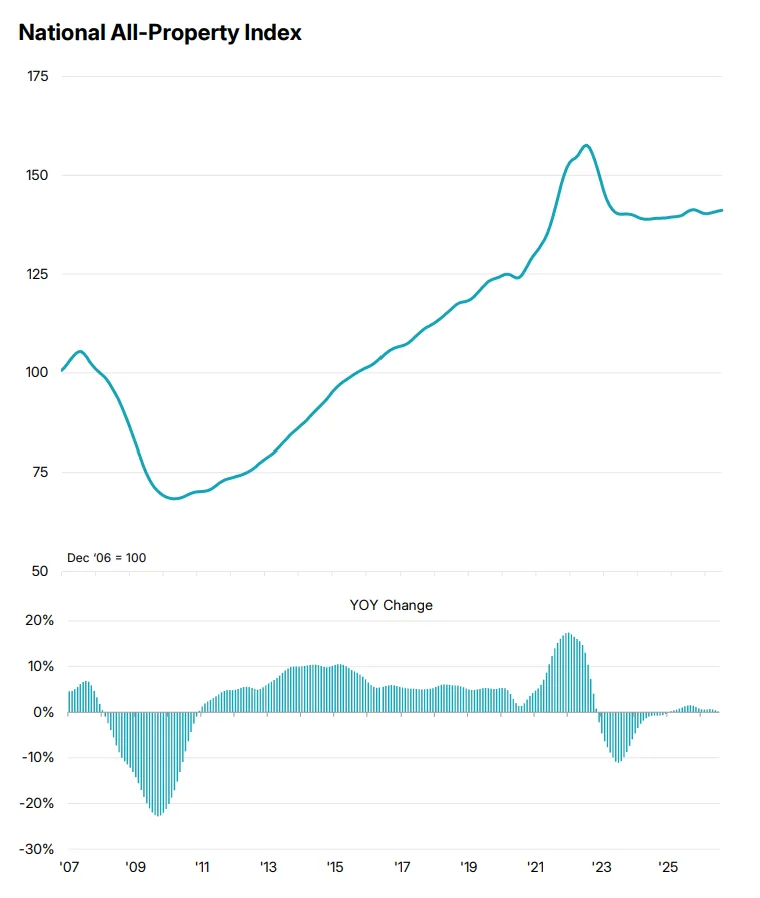
- The RCA CPPI National All-Property Index rose 0.2% over the year in July, its slowest gain since January 2025.
- Apartment prices fell 4.1% over the year and sit 22% below their July 2022 peak.
- CBD office led all property types, up 9.9% over the year, and now runs well ahead of suburban office.
Commercial Property Prices Barely Budge
US commercial property prices edged up in July but nearly stalled. The RCA CPPI US National All-Property Index rose 0.2% from a year earlier, per MSCI. That marked its slowest annual gain since January 2025. Prices ticked up 0.1% from June, an annualized pace of 1.2%.
The reading shows a market treading water rather than recovering. Over three months, the national index gained just 0.3%. The three-year increase stands at only 0.7%. However, values remain 35.1% higher than a decade ago.
Get Smarter about what matters in CRE
Stay ahead of trends in commercial real estate with CRE Daily – the free newsletter delivering everything you need to start your day in just 5-minutes
Source: MSCI
Rates Stay Higher for Longer
Financing costs give owners little relief. The Federal Reserve held its policy rate steady in a divided vote. Its chair ruled out easing the inflation target. Investors now see little chance of a near-term cut. That keeps borrowing conditions tight across commercial real estate.
Those conditions continue limiting how quickly pricing can reset. Higher debt costs can restrict buyer leverage and complicate refinancing for existing owners. The result is a market where improving sentiment has yet to translate into broad price appreciation.
The Details
Performance split sharply by property type. Apartment prices fell 4.1% from a year earlier and slipped 0.8% for the month. Industrial prices dropped 1.0% annually and were flat from June. Annual industrial growth stood at 4.4% as recently as August 2025.
Retail eased 0.9% from a year prior but rose 0.3% for the month. More recent momentum looks stronger than the annual figure suggests. MSCI reported retail prices have increased every month since March. Late-2025 declines continue weighing on the year-over-year comparison.
The longer-term numbers also show how differently sectors have performed. Industrial values remain 25.4% above their level five years ago. Apartment values are 7.1% lower over that period. Overall office prices remain 13.7% lower.
Office Flips the Script
CBD office jumped 9.9% over the year, the strongest gain of any property type. Prices also climbed 1.6% from June. Suburban office gained 4.0% annually and 0.4% monthly.
The office split marks a clear reversal. Suburban office had outgrown CBD office annually for more than five years. That changed in February 2026, when CBD pulled ahead by 20 bps. The CBD lead has since widened to nearly 600 bps.
Still, CBD office remains far from its earlier pricing levels. Its index is down 16.2% over three years. It has fallen 41.1% over five years and 35.9% over ten years. Suburban office, meanwhile, remains 15.3% higher over the past decade.
Major Markets Lose Their Edge
Geography adds another divide. Prices across six major metros fell 0.2% annually and 0.2% during July. Non-major metros gained 0.8% annually and 0.3% for the month.
The longer view makes that divergence more pronounced. Major-metro prices have fallen 4.8% over three years and 9.9% over five. Non-major metros gained 3.4% and 6.5% across those same periods.
MSCI defines the six major metros as Boston, Chicago, Los Angeles, New York, San Francisco, and Washington DC. Secondary and tertiary markets make up the non-major group.
Why It Matters
The numbers show a two-speed market rather than a broad rebound. Pricing signals remain uneven across major CRE benchmarks.
Apartment values remain 22% below their July 2022 peak. The sector has now posted annual price declines for nine consecutive months.
Meanwhile, CBD office is gaining quickly despite remaining deeply below prior levels. Secondary markets are also outperforming the largest metros. Buyers and lenders are rewarding specific sectors and markets instead of lifting CRE broadly.
The RCA CPPI uses repeat-sales transactions to track property price movements. MSCI can revise historical readings as additional transaction data becomes available. That makes each monthly release another checkpoint in a still-uneven pricing recovery.