





- 96.3% of non-performing CMBS mall loans were originated in 2016 or earlier, while loans written since 2017 are performing at essentially a 100% rate, according to Trepp’s CMBS Datafeed as of July 27, 2026.
- The split traces to the shift from post-crisis CMBS 2.0 underwriting to the tighter, risk-retention-driven CMBS 3.0 era beginning in 2017, compounded by a selection effect in which lenders only wrote new mall loans against properties that still looked financeable.
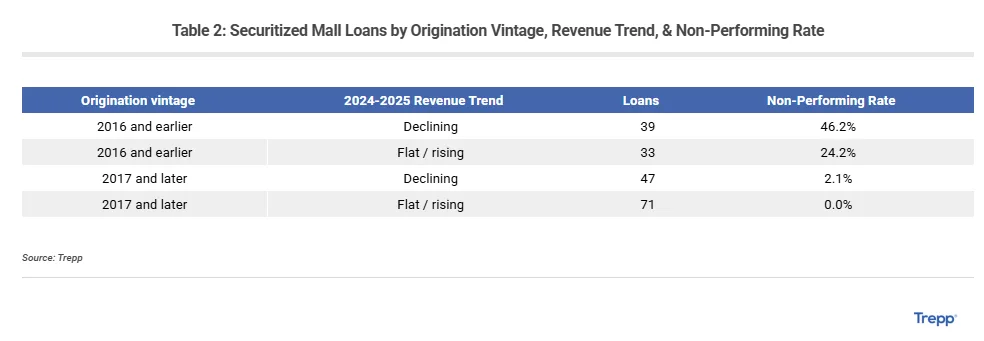
- Revenue trends and debt yield only meaningfully predict distress within the pre-2017 vintage — even mall loans with rising revenue in that older book carry a 24.2% non-performing rate — meaning origination year and looming maturity dates matter more to CMBS investors than a loan’s current financial snapshot.
A stark loan vintage split defines distress in the CMBS mall-loan market, according to a Trepp analysis of loans backed by regional and superregional malls: 96.3% of non-performing loans were originated in 2016 or earlier, while loans written since 2017 are performing at essentially a 100% rate. The data comes from Trepp’s CMBS Datafeed as of July 27, 2026. It’s the pre-2017 loans now hitting their balloon dates in a higher-rate refinancing market, while the newer book still has years before maturity.
Get Smarter about what matters in CRE
Stay ahead of trends in commercial real estate with CRE Daily – the free newsletter delivering everything you need to start your day in just 5-minutes
The CMBS 3.0 Turning Point
The divide lines up with a regulatory shift, not a market cycle. The end of 2016 marks the transition from the post-crisis CMBS 2.0 era to CMBS 3.0, when new risk-retention rules pushed underwriting standards higher across the securitized lending market. Lenders writing new mall loans after that point were also selecting for survivors — only properties that still looked financeable could get refinanced once the retail sector’s structural troubles were already visible, according to Trepp.
Where the CMBS Mall Loan Risk Sits
Trepp defines a loan as non-performing if it’s 30 or more days delinquent, past its maturity date without paying off, in foreclosure, or real estate owned. By that standard, 13 loans are in performing matured-balloon status — past due but still paying — and every one of them originated in 2016 or earlier, marking the leading edge of a maturity wall still working through the system. Revenue trends barely move the needle once vintage is accounted for: in the post-2016 book, a revenue decline lifts the non-performing rate from zero to just 2.1%, while pre-2017 loans with flat or rising revenue are non-performing at 24.2%, rising to 46.2% when revenue is falling. Debt yield tells a similar story — pre-2017 loans with a sub-6% debt yield carry a 69.2% non-performing rate, but better-covered older loans still bounce between 18% and 41%, meaning debt yield only sorts outcomes cleanly at the very bottom of the range. Trepp notes that revenue’s real value is forward-looking: it sits at the top of the cash-flow waterfall, the order in which a property’s income covers expenses and debt before equity, so a sustained decline erodes future net operating income and refinanceability even on a loan that is current today.
Zooming Out
The pattern echoes what’s already surfaced in individual mall workouts — Destiny USA’s CMBS debt is projected to face more than $350 million in losses, another case of an older-vintage mall loan running into refinancing trouble. It also lines up with the broader direction of the CMBS market: special servicing rates have been easing across property types as office and lodging loans recover, even as mall debt remains concentrated in a single problem vintage rather than spread evenly across the sector.
Why It Matters
For CMBS investors and special servicers, the takeaway is that a loan’s origination year and looming maturity date matter more than its current financial snapshot. Three loans in the report make the point directly: Oro Valley Marketplace remains current despite a 5.5% debt yield and a 16% revenue decline, while Market Square — with revenue up 15% — still landed in REO because its 2015-vintage loan couldn’t refinance at its balloon. The Summit cuts the other way: its revenue fell 36%, the steepest drop in Trepp’s sample, yet it sits comfortably current because it’s a 2023-vintage loan with years left before maturity. Trepp’s data suggests the sector’s real risk gauge isn’t which malls are losing revenue today, but how much of the pre-2017 legacy book still has to clear its maturity wall.
What’s Next
With the 2016-and-earlier vintage still working through balloon maturities in a higher-rate environment, more of these loans are likely to either refinance, extend, or follow Market Square into special servicing over the coming quarters. Trepp’s data — pulled from its CMBS Datafeed as of July 27, 2026 — points to origination year as the metric worth tracking next, rather than any single property’s current revenue or coverage trend.