




- US apartment cap rates averaged 5.79% in Q2 2026, the highest since 2015, per RealPage Analytics.
- Mid- and high-rise properties captured 51.8% of dollar volume, outpacing garden apartments for the first time in 25 years.
- Deal volume stabilized year-over-year at $36.7B, despite fewer properties changing hands and a shift toward larger deals.
A Shift in Apartment Investment Patterns
Apartment cap rates in the US climbed to their highest level in over a decade as transaction activity steadied but increasingly concentrated on larger, higher-density assets. RealPage Analytics reports that in Q2 2026, the average cap rate reached 5.79%, exceeding any quarter since Q3 2015. Even as total deal volume held at $36.7B—just 1% below last year—the pool of selling properties shrank by 7.4%, forcing average deal sizes higher. Notably, for the first time in 25 years, mid- and high-rise buildings accounted for more than half of all apartment dollar volume.
This marked compositional change, more than outright price growth, propped up per-unit pricing to $206,982. The focus on larger urban product signals investor preference for scale and density amid ongoing capital market uncertainty.
Get Smarter about what matters in CRE
Stay ahead of trends in commercial real estate with CRE Daily – the free newsletter delivering everything you need to start your day in just 5-minutes
The Details
According to data from MSCI Real Capital Analytics, 1,631 US apartment properties traded in Q2 2026, representing $36.7B in volume—a nearly identical sum to Q2 2025, but achieved with 9.7% fewer units. The average transaction size hit $22.5M, up from $20.4M in Q1. Cap rates averaged 5.79%, rising from 5.71% in Q1 and 5.52% a year before, and now sit 114 basis points above their 2022 trough.
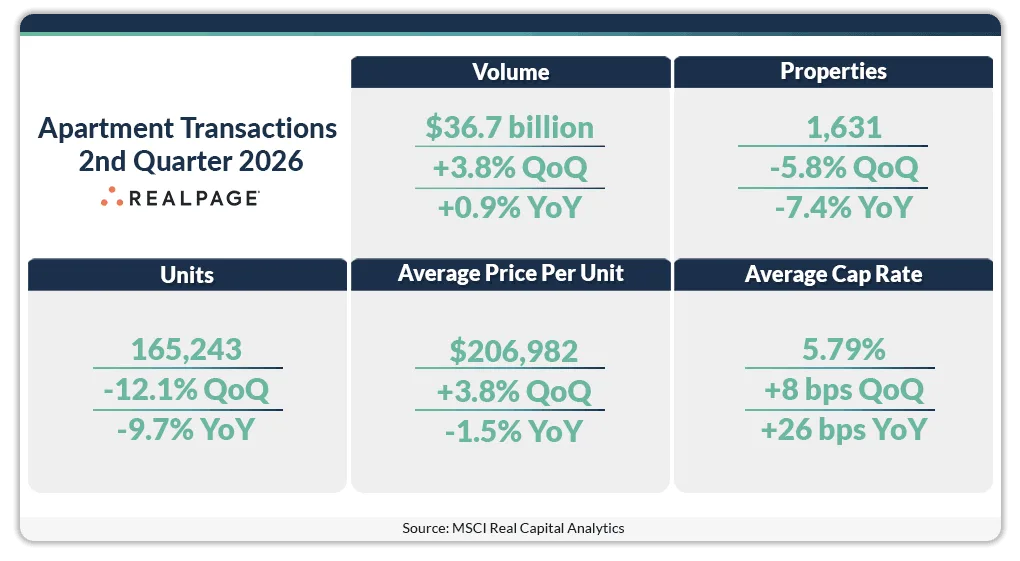
Mid- and high-rise assets commanded 51.8% of quarterly volume, jumping 39.1% quarter-over-quarter to $19B. Those properties traded at an average of $288,335 per unit, compared with $164,777 for garden apartments. This tilt, rather than broad price appreciation, boosted the blended per-unit figure compared to Q1.
Urban Assets Take the Lead
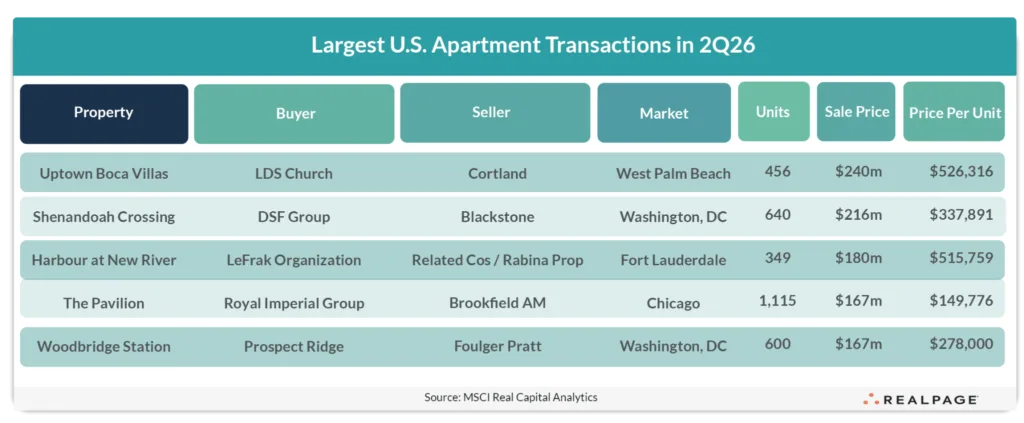
The composition of recent transactions shows urban, higher-density product dominating investment activity. Garden apartments, long the volume leader, ceded majority share as bidders vied for trophy mid- and high-rise assets in gateway and high-growth markets. The top five deals ranged from $167M to $240M, all involving institutional portfolios and major metros—two apiece in South Florida and Northern Virginia, plus a Chicago high-rise totaling 1,115 units. Los Angeles led in dollar volume at roughly $1.4B, while San Francisco logged the most individual sales at 111 properties.
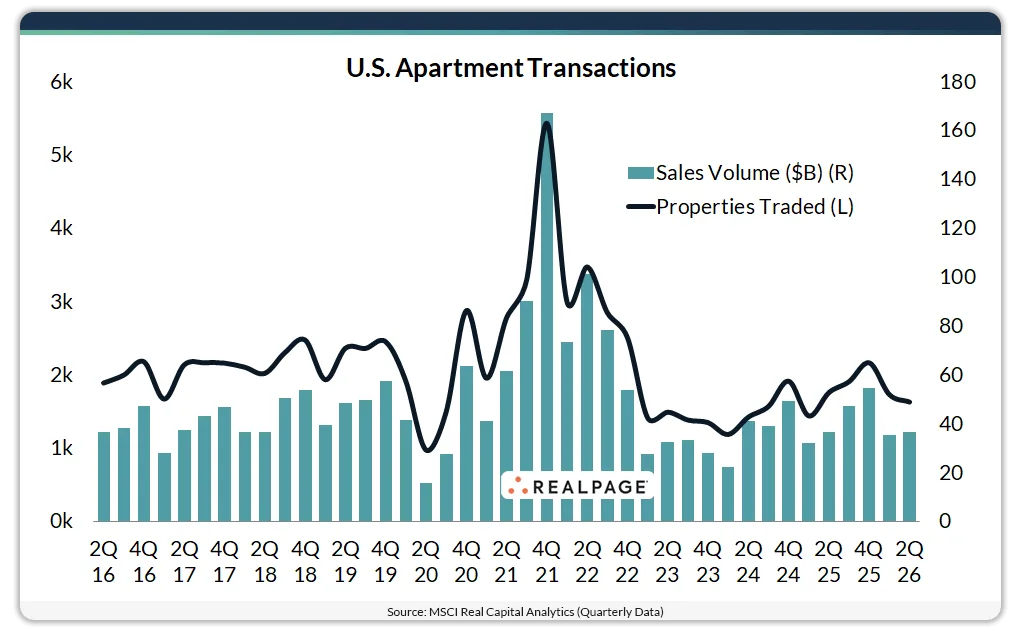
Over the year ending Q2 2026, total apartment sales reached nearly $174B across 7,439 properties—an 11.1% volume gain, though still far below the $359.6B seen during the 2021 peak.
Why It Matters
Cap rates pushing to 11-year highs reflect persistent capital market uncertainty and investors’ need for greater risk premiums. Meanwhile, small-balance financing has continued supporting multifamily transactions as borrowers navigate tighter lending conditions. Yet, apartments remain the most competitive major property type for yield, according to RealPage Analytics and MSCI RCA.
The new dominance of mid- and high-rise assets signals a pronounced preference for larger, denser, and likely better-located product, with scale viewed as a buffer in an environment of elevated borrowing costs and shifting fundamentals. Institutions, rather than local operators, drove Q2’s largest deals, underscoring a market that rewards access to capital and portfolio diversification. While total transaction volume has not recovered to pandemic-era heights, the stabilization versus 2025—despite fewer properties and units involved—hints at a market gradually finding equilibrium with the new interest rate environment.
Market participants should track whether this shift in deal mix is a new normal or a temporary blip driven by opportunistic buyers and portfolio restructuring. Either way, the data points to a CRE market where size, location, and operational resilience increasingly drive valuation.
What’s Next
With capital still in the market and motivated sellers securing buyers, all eyes are on whether mid- and high-rise product will continue to dominate through 2026. The second half could see garden apartments attempt to reclaim their historic majority as conditions evolve. Meanwhile, cap rates are likely to remain elevated absent a major shift in financing costs, and investors may stay choosy as volume rebuilds from 2023’s trough. Per RealPage Analytics, the interplay of product type and capital markets will remain the key story shaping apartment investment for the remainder of the year.