





- US apartment concession use declined in June, following typical seasonal patterns rather than signaling broad relief.
- Southern and Western metros posted the most widespread and deepest concessions, with Austin leading in both usage and discount size.
- Regional and market-level differences highlight the importance of tracking both usage and depth to gauge rental incentive pressure.
Different Playbooks in Use
Apartment owners nationally reduced rent concessions in June. However, RealPage Analytics says the change reflected normal seasonality, not a sustained market shift.
National usage edged lower, but regional strategies varied widely based on supply and competition. Several Southern and Western metros used broader or deeper concessions. Meanwhile, other markets reduced incentives or targeted specific renters.
These differences highlight renters’ varying bargaining power across regions. Discounts also remain elevated from last year. Therefore, investors and property managers should track both concession breadth and depth.
Get Smarter about what matters in CRE
Stay ahead of trends in commercial real estate with CRE Daily – the free newsletter delivering everything you need to start your day in just 5-minutes
The Details
The South continued to report the broadest concession use. As of June, 21.9% of stabilized units offered incentives, according to RealPage Analytics. The West followed at 14.9% but recorded the steepest monthly decline of 0.8 percentage points.
The Northeast increased slightly to 11.2%, while the Midwest remained lowest at 10%. The West offered the deepest average concession at 11.9%. The South followed closely at 11.6%.
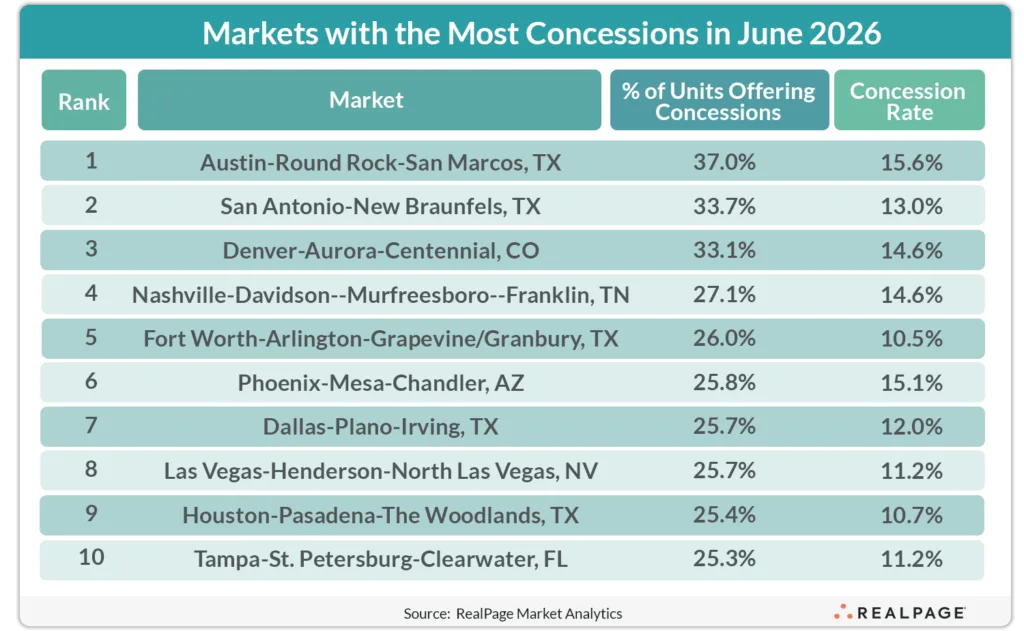
Austin led individual markets, with 37.0% of stabilized units offering concessions. Its average discount reached 15.6%. Phoenix, Denver, and Nashville each exceeded 25% usage and offered average discounts of at least 14.6%.
Concession Pressure Clusters and Shifts
Markets did not rely equally on deep discounts, even where concession usage remained high. San Antonio, Fort Worth, and Houston offered widespread incentives but kept discounts below leading markets.
Texas metros represented half of the top 10 concession markets. That concentration highlights persistent incentives across the state despite shifting demand conditions. Phoenix and Dallas entered the top 10 in June, while Atlanta and Charlotte dropped out.
Dallas, Las Vegas, Houston, and Tampa clustered near the top-usage threshold. Small changes in rents or lease-up activity can quickly reshuffle rankings. This volatility highlights how rapidly local concession strategies can change.
Why It Matters
National concession usage may suggest stabilization, but local conditions continue driving sharply different strategies. High-growth Sun Belt markets face particularly intense competition as apartment deliveries continue.
Austin’s 37.0% concession rate and 15.6% average discount signal meaningful rent pressure. That pressure could weigh on effective rents and property yields. Recent trends also show landlords offering concessions across fewer units while increasing the value of individual discounts.
Meanwhile, the Northeast and Midwest continue using fewer and shallower concessions. Operators offering larger incentives face greater income risk in oversupplied or highly competitive markets.
Investor Implications
Investors and owners should recognize that operators increasingly tailor incentive strategies to local conditions. High concessions across the South and West could continue weighing on rent growth and property revenue.
National concession levels may ease slightly while individual markets remain under pressure. Markets with broad and deep discounts could face pricing challenges for months. Continued Sun Belt apartment deliveries may extend that pressure.
What’s Next
Seasonal trends could produce further modest declines in concession usage through late summer. However, regional differences in pricing power should remain significant as new units deliver.
Austin, Phoenix, and Dallas could maintain elevated concessions as developers work through pipeline backlogs. Operators should closely track both concession usage and discount depth through year-end 2026.
Slower supply pipelines could eventually narrow regional differences in concession depth. For now, local market conditions remain central to rental pricing strategies.