









- Publicly traded REITs outpaced the US equity market in H1 2026 as sector fundamentals and capital access improved.
- Operational performance and balance sheet discipline drove sector-wide gains, with consolidation fueling larger, more efficient REITs.
- Widening public-private valuation gaps and access to diverse capital suggest REITs are positioned for continued outperformance.
Early 2026 REIT Upswing Defies Equity Trends
Publicly traded REITs kicked off 2026 with strong outperformance, reversing the underwhelming returns seen in 2025. According to Nareit’s mid-year update, the sector returned 14.9% by June, surpassing the Russell 1000’s 10.3% gain and regaining ground lost during 2025’s tech-driven rally. The rebound comes as geopolitical tensions and higher-for-longer interest rates cloud the outlook for other asset classes.
The mid-year reversal underscores the sector’s ability to perform even when monetary policy remains tight. Historical data shows that years beginning with strong outperformance, including 2006 and 2014, often end with gains exceeding broad equities. This year’s momentum also suggests resilience against shocks that derailed previous rallies, including 2025’s tariff disruptions.
Get Smarter about what matters in CRE
Stay ahead of trends in commercial real estate with CRE Daily – the free newsletter delivering everything you need to start your day in just 5-minutes
The End of Post-COVID Underperformance
Last year, only five of 13 major REIT sectors posted positive returns, with healthcare leading at 28.5% as data centers lagged. The first half of 2026 marked a reversal: nearly every REIT sector, except gaming and telecom, delivered gains. Lodging/resorts emerged as the top performer, yielding a striking 42.8% total return through June.
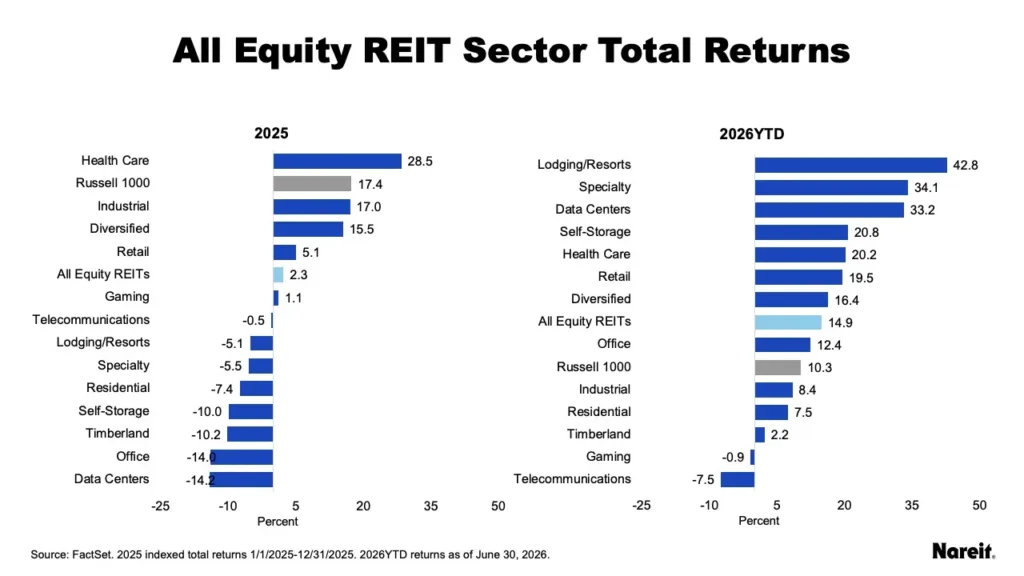
This sectoral boost is underpinned by demographic shifts and demand in emerging categories—over half of REIT market cap now sits in sectors reshaped by digitization and housing shortages. These structural changes are driving strategic adoption of REIT-heavy completion strategies among institutional investors, seeking broader exposure to modern segments often missed by traditional private real estate.
The Details
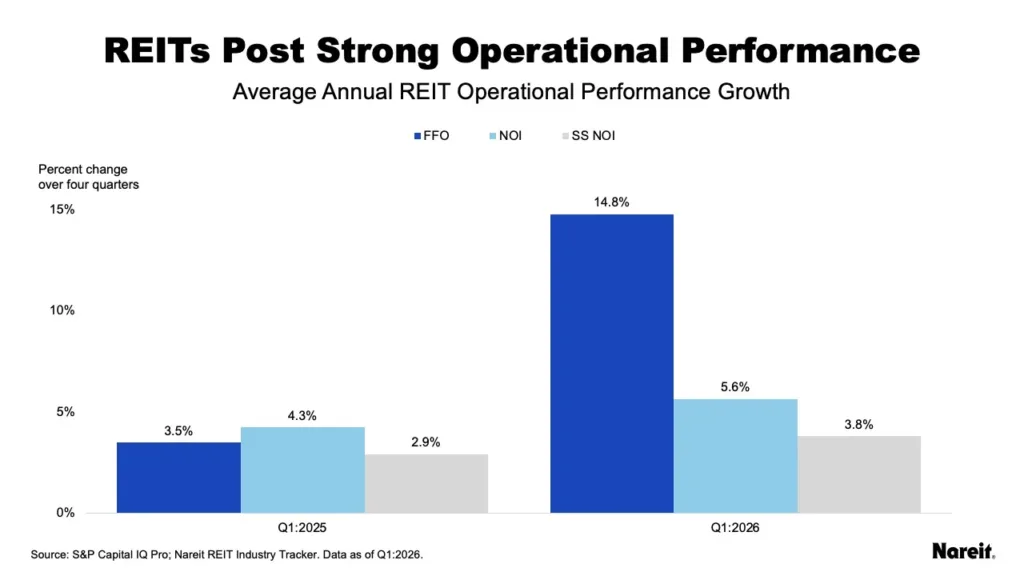
Operationally, REITs shored up their financial footing in 2026. First-quarter FFO, NOI, and same-store NOI rose 14.8%, 5.6%, and 3.8%, respectively—beats on all fronts compared to 2025, per Nareit. Nearly 65% of REITs posted FFO gains, 75% showed positive NOI growth, and the same percentage recorded higher SS NOI.
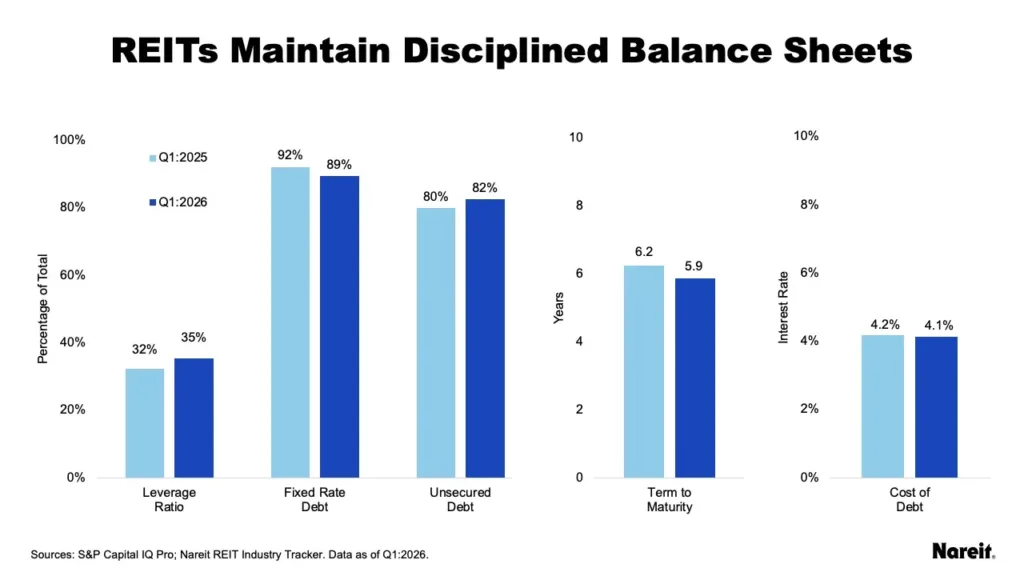
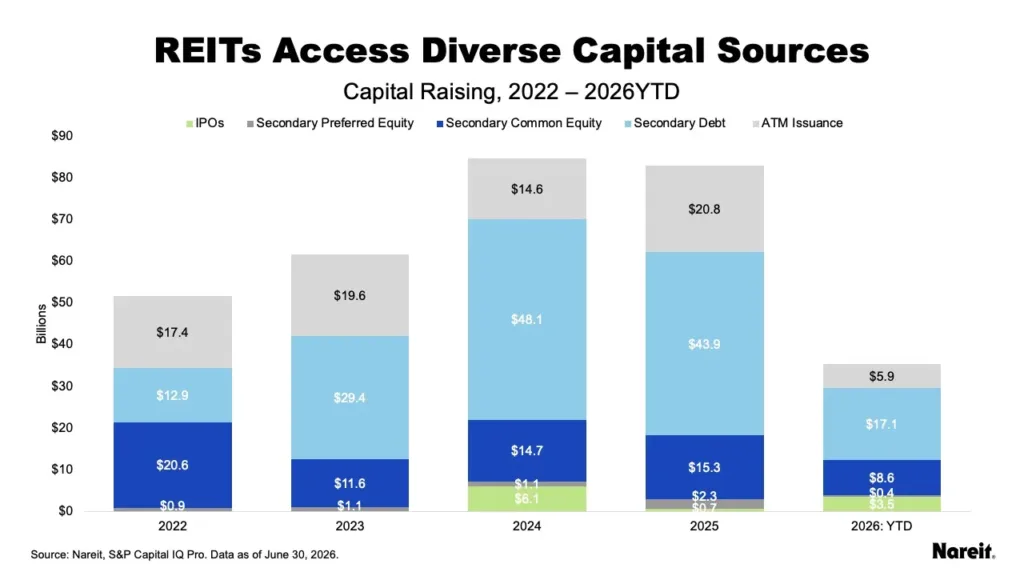
Balance sheets remain a strength. REITs are keeping leverage low, favoring fixed-rate, long-term unsecured debt access. Average coupon rates for new debt offerings held steady at around 5.3%. Through June, capital raised reached $35.4B—nearly half from secondary unsecured debt, and the rest via common shares, ATM offerings, and IPOs, including several in high-growth subsectors like healthcare and data centers.
Narrowing Valuations and Aggressive M&A
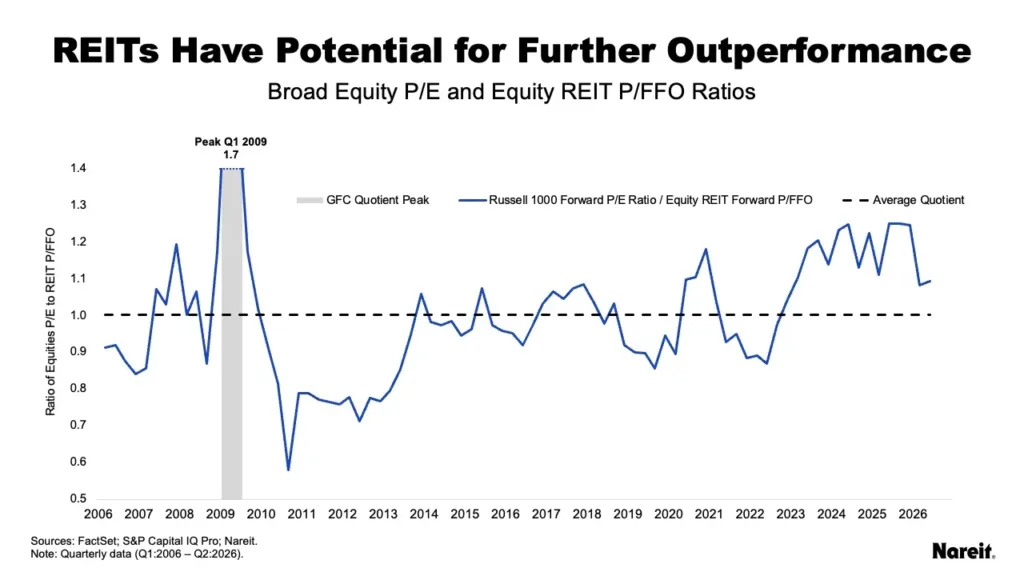
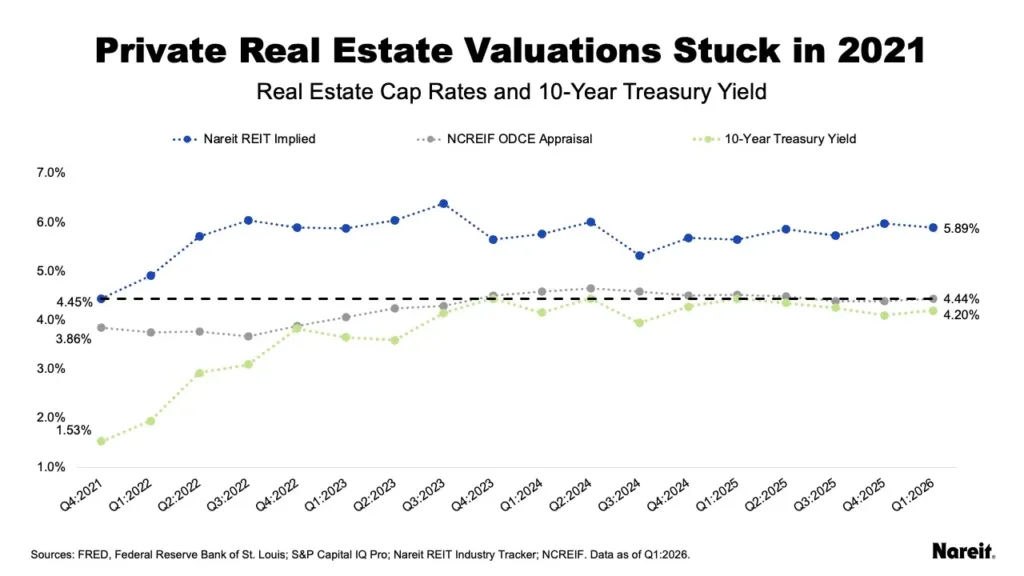
The tech rally’s cool-down in 2026 narrowed the valuation gap between REITs and the Russell 1000, pushing traditional P/E and P/FFO multiples closer. While the public market gap to private appraised property values lingers, persistent high private valuations seem increasingly out of sync. As private appraisals catch up to public market pricing, REITs could further extend their lead in relative performance.
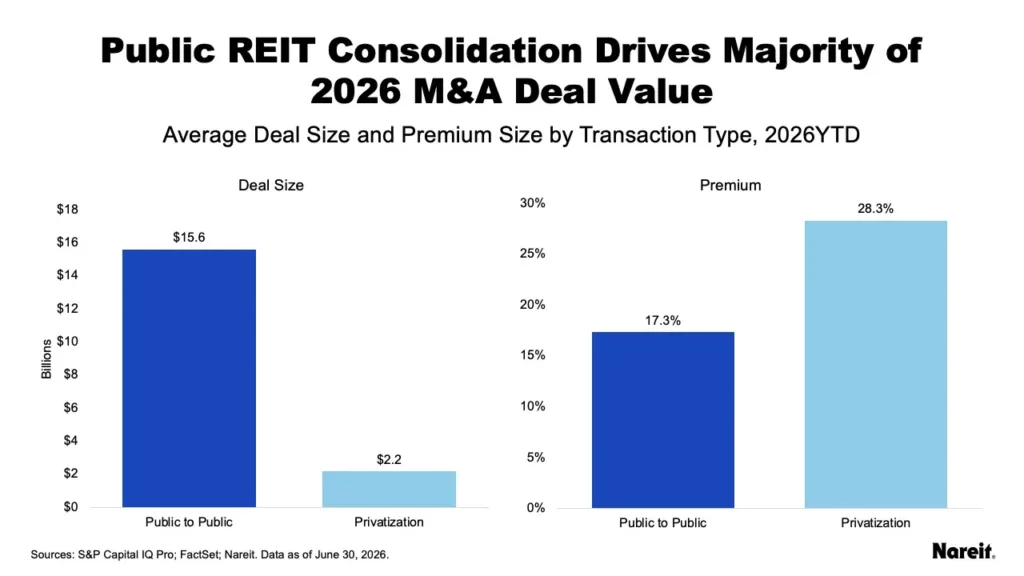
The year also saw consolidation surge. Eight M&A deals through June totaled $57.7B, with over 80% of volume driven by strategic REIT-to-REIT mergers instead of privatizations. Public REITs’ average market cap now tops $11B, reflecting the scale efficiencies targeted by these transactions. Smaller, premium privatizations account for a shrinking share of transactional activity as public players bulk up for operating leverage.
Why It Matters
REITs’ strong first half could signal continued outperformance through year-end, according to Nareit historical data. Broad NOI and FFO growth also point to improving property-level fundamentals despite elevated rates.
Access to capital remains a key advantage for public REITs. The sector raised $35.4B through June, far outpacing private market liquidity. Meanwhile, a persistent public-private valuation gap could trigger further capital rotation into listed REITs.
Lodging and other pandemic laggards are also benefiting from improving demand trends. As property markets normalize, REITs continue offering investors liquidity, scale, and diversification.
What’s Next
Capital market conditions remain favorable for REITs entering the second half of 2026. Continued consolidation could drive more public-to-public mergers as smaller REITs pursue scale.
The valuation gap with private real estate may spur additional institutional reallocations into listed REITs. That trend could accelerate as private market pricing adjusts to higher rates.
Policy changes and macro shocks remain key risks for the sector. Still, healthcare, logistics, and data centers continue attracting investor interest. Those growth sectors could support REIT performance through 2027.