






- The US apartment market saw robust demand and occupancy improvements in Q2 2026, absorbing more than 187,000 units.
- Annual apartment deliveries and rent growth varied regionally, with Sun Belt markets lagging but tech coast metros leading in price appreciation.
- National occupancy rebounded to 95.5% as new supply declined, but overall demand and rents remain below decade norms, signaling a still-cautious recovery.
Supply Falls, Allowing Occupancy Recovery
After years of surging new construction, the US apartment sector is finally seeing supply moderate. According to RealPage Market Analytics, the year ending Q2 2026 marked the first time in three years that annual deliveries—about 340,200 units—fell below the decade average. This steady decline, now six quarters running from the 2024 peak of 588,000 units, is starting to relieve pressure on occupancy and rents. With absorption picking up and construction tapering, the sector is seeing some long-awaited stability after a volatile post-pandemic cycle marked by overbuilding and uneven demand.
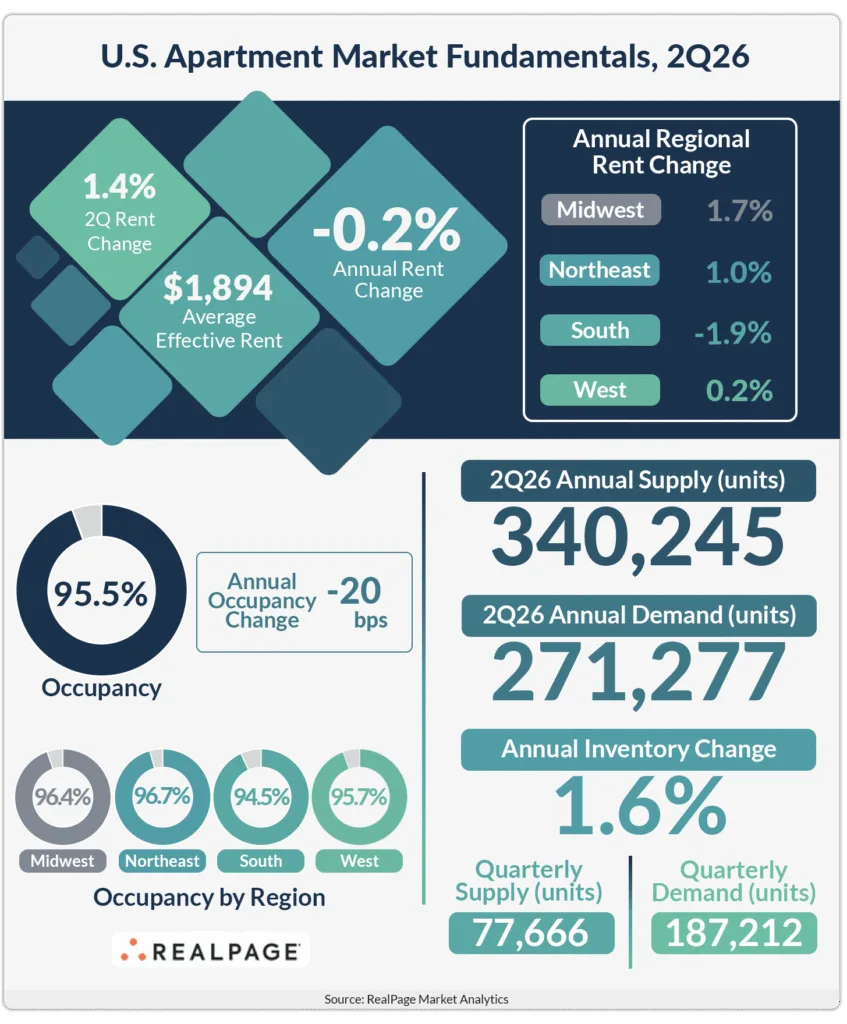
The Details
Net absorption reached 187,000 units in Q2 2026, outpacing seasonal expectations and boosting overall occupancy rates to 95.5%, a modest increase for the second consecutive quarter, per RealPage. Still, trailing demand—271,300 units for the previous twelve months—remained below the decade’s 340,000-unit average. While rent growth intensified quarter-over-quarter, rising 1.4%, effective rents were still down 0.2% from the prior year. Nearly a quarter of apartments (24.6%) offered concessions averaging 7.6%. The volume of new deliveries in Q2 alone—77,700 units—reflects the sector’s ongoing recalibration as pipeline activity cools from its earlier highs.
Regional Divergence Sharpened in Q2
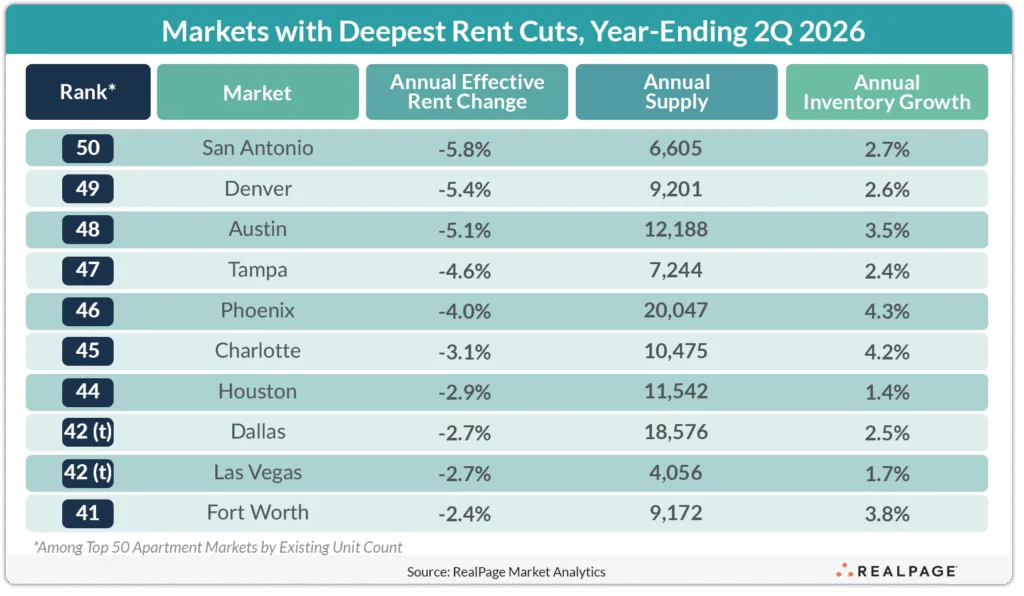
Beneath the national averages, sharp divides persist by region. The South is the only US region still experiencing year-over-year rent declines, in part because occupancy there remains below 95%. Sun Belt markets like San Antonio, Austin, and Phoenix continued to report negative rent growth, reflecting high levels of new supply and slower-than-expected absorption. Meanwhile, Class C units in tourism-reliant Sun Belt metros such as Las Vegas and Tampa saw deep annual rent drops (6.6% and 8.6%, respectively) due to weaker demand from service-sector workers. In contrast, tech-driven coastal cities—led by San Francisco (up 10.6% annually) and San Jose (6.1%)—benefited from resilient job growth and lighter new construction, supporting outsized rent increases. Midwest markets with limited new supply, including Milwaukee, Chicago, and Minneapolis, also posted solid gains.
Why It Matters
This Q2 data signals an important turning point for the US apartment sector, with implications for investors, operators, and lenders alike. The continuing decline in new supply is helping the sector absorb leftover vacancies from the recent building surge even as broader demand is still running below the highs of the last decade. RealPage’s report shows that while major markets struggle with localized oversupply (especially in the Sun Belt), the overall sector has regained enough traction to push national occupancy slightly above its ten-year average—a key milestone for owner confidence and lender underwriting.
Rent pressures remain uneven. Despite Q2’s 1.4% quarterly gain, effective rents are still slipping year-over-year in nearly a quarter of US markets, with concessions common in highly competitive areas. Yet the performance of tech-centric coastal metros and some Midwest cities demonstrates that location and supply discipline make all the difference. With San Francisco’s rents climbing by double digits, and more moderate but positive gains in places like Milwaukee and Chicago, selectivity will be crucial for investors placing bets in the current cycle. The report also points to persistent stress in Class C product and tourism-dependent regions, emphasizing the need for operators to tailor strategies to local labor and consumer dynamics.
What’s Next
As annual deliveries are expected to continue declining—thanks in part to tighter capital markets and higher construction costs—operators and investors should anticipate further stability, but not runaway growth, in national occupancy and rents. Market observers will be watching to see if lagging demand in the South and Sun Belt starts to recover as supply pressure abates. Attention will also focus on whether tech-driven job markets can sustain their current rental momentum as the economic cycle evolves. For now, the sector appears to be shifting from a boom-bust dynamic to a steadier, more nuanced recovery.