


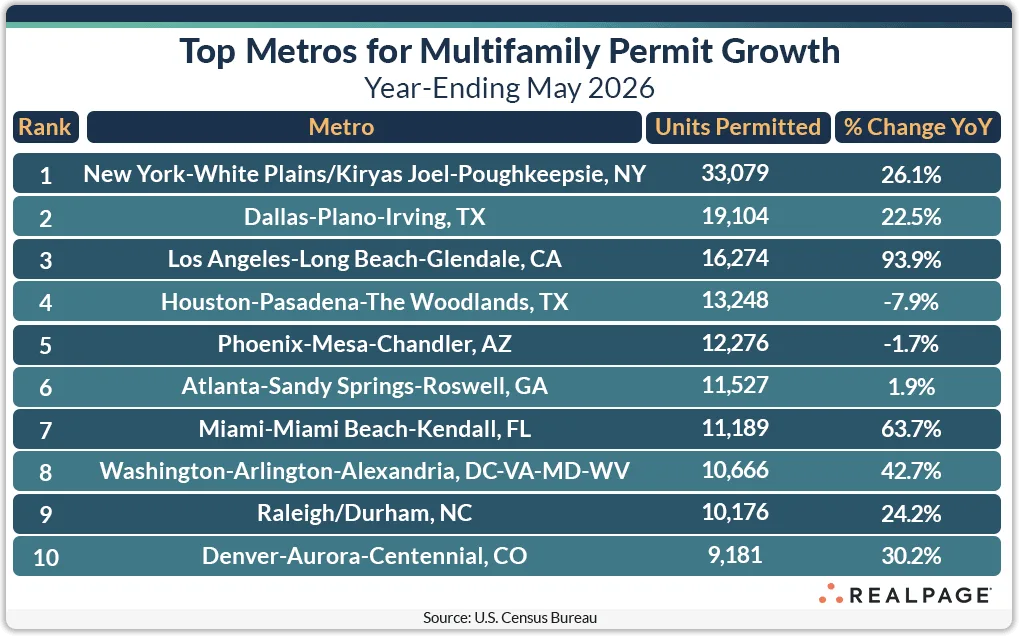
- Multifamily construction permitting jumped 24.4% YoY across the top 10 US metros in May 2026, per RealPage Analytics.
- Major gainers included Los Angeles, Washington DC, and New York, while large declines hit Sun Belt cities like Austin and San Antonio.
- Regional and market-level disparities underscore economic mixed signals for multifamily developers and investors.
Momentum Diverges Across Metro Lines
Multifamily construction trends stayed uneven in May 2026 as the nation’s permitting pipeline reflected a patchwork of economic signals. According to the RealPage Analytics Blog, the majority of the top permitting markets—seven out of the 10 largest—posted significant annual gains, averaging a 43% jump or roughly 4,250 additional units compared to last year. Los Angeles led the charge, nearly doubling its permitting activity since May 2025. At the same time, strong momentum surfaced in places like San Jose, Salt Lake City, and Seattle. But while some metros raced forward, others—especially in the Sun Belt—hit the brakes sharply.
This divergence mirrors broader economic signals. As job growth varies by region, so does appetite for new multifamily supply. RealPage notes that the top 10 metro permitting total was up 24.4% year-over-year, yet essentially flat from April, indicating bifurcation is intensifying in the national construction narrative.
Get Smarter about what matters in CRE
Stay ahead of trends in commercial real estate with CRE Daily – the free newsletter delivering everything you need to start your day in just 5-minutes
The Details
Among major metros, Los Angeles saw the sharpest permitting growth with a 47.6% spike from December 2025. Washington, DC was up 42.5%, while New York and Raleigh/Durham increased 27.4% and 30.3%, respectively. Other notable gainers outside the perennial leaders included San Jose (+4,534 units), Salt Lake City (+2,190), and Cincinnati (+2,077). On the flip side, the Atlanta metro trimmed its annual permitting by 8%, or 1,144 fewer units.
The most striking pullback came from previously red-hot Sun Belt markets: San Antonio’s annual permitting plummeted by nearly 77% (-2,889 units), Austin fell 33% (-4,309), and Las Vegas slid almost 37% (-1,237). Smaller metros weren’t immune either—Lakeland–Winter Haven, FL and Augusta, GA both lost 80–97% of their annual permitting volumes.
Permitting Hotspots Shift Within Metros
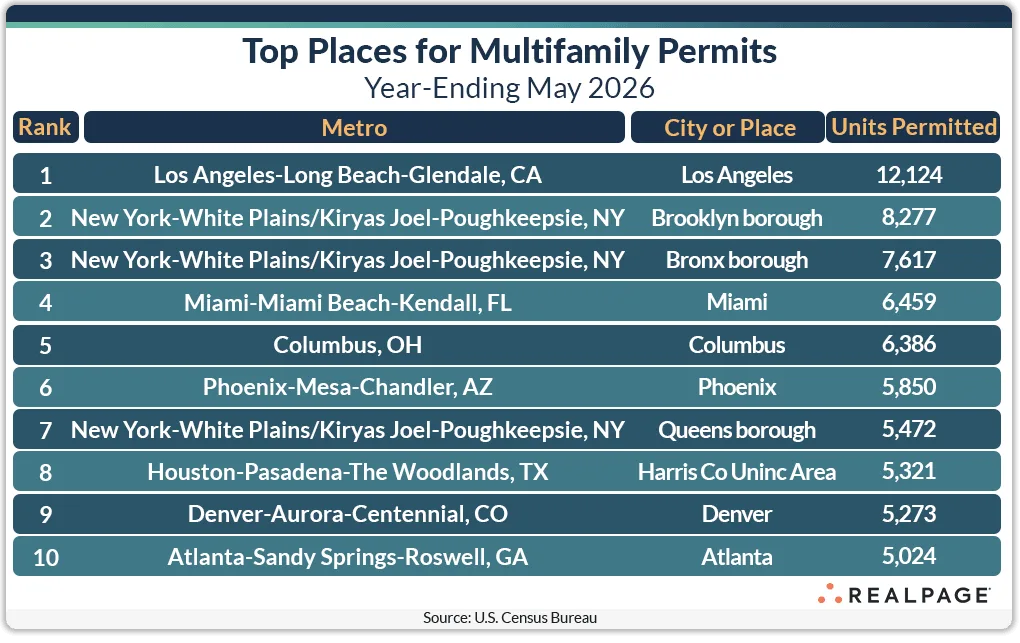
The picture changed again below the metro level. Eight of April’s top 10 permitting markets stayed on the list in May. However, Miami and Cleveland swapped the #4 and #5 spots. Each approved about 6,400 units. Phoenix held the #6 position with 5,850 units.
Queens entered the top 10 as Austin dropped out. Meanwhile, unincorporated Harris County climbed one spot. Texas placed only one city or county in the top 10. Still, six Texas locations ranked in the top 20.
Only three of the top 10 permitting markets increased annual totals from April. Each added an average of 540 units. Meanwhile, the other seven markets averaged a decline of 360 units. Columbus stood out after issuing 1,250 fewer units than in April.
Polarized Growth in Multifamily Markets
The latest RealPage Analytics data shows a widening split in multifamily construction. Los Angeles, Washington, New York, and Raleigh-Durham posted strong permitting growth. These markets continue to attract demand despite high barriers to entry. This shift builds on earlier permitting patterns that already showed stronger momentum in major metros than in many secondary markets.
Meanwhile, Texas and Florida metros saw sharp pullbacks. Slower Sun Belt migration, shifting capital flows, and weaker rent growth expectations drove the decline. Austin’s permitting volume fell by 4,309 units, or 33.3% year over year. San Antonio recorded an even steeper 77% drop.
Nationally, the top 10 markets increased annual multifamily permitting by 24.4%. However, many smaller and secondary markets contracted. Developers appear to be recalibrating risk. They now favor larger, more stable urban markets as construction costs, interest rates, and operating conditions remain uncertain.
This divide points to a riskier outlook for multifamily investors. Sun Belt lease-up markets and smaller metros may face greater pressure if demand continues to soften.
What’s Next
The coming months will test this market split as economic volatility and high financing costs continue. Developers will likely focus deals and new projects in Los Angeles, New York, and Washington, DC. These markets offer stronger demand and greater resilience.
Meanwhile, Sun Belt markets may face continued permitting headwinds. Oversupply, uneven job growth, and pressure from single-family housing could slow activity further. Regional differences in multifamily construction will likely remain pronounced through the rest of 2026. Developers and investors will keep adjusting to changing market conditions.