


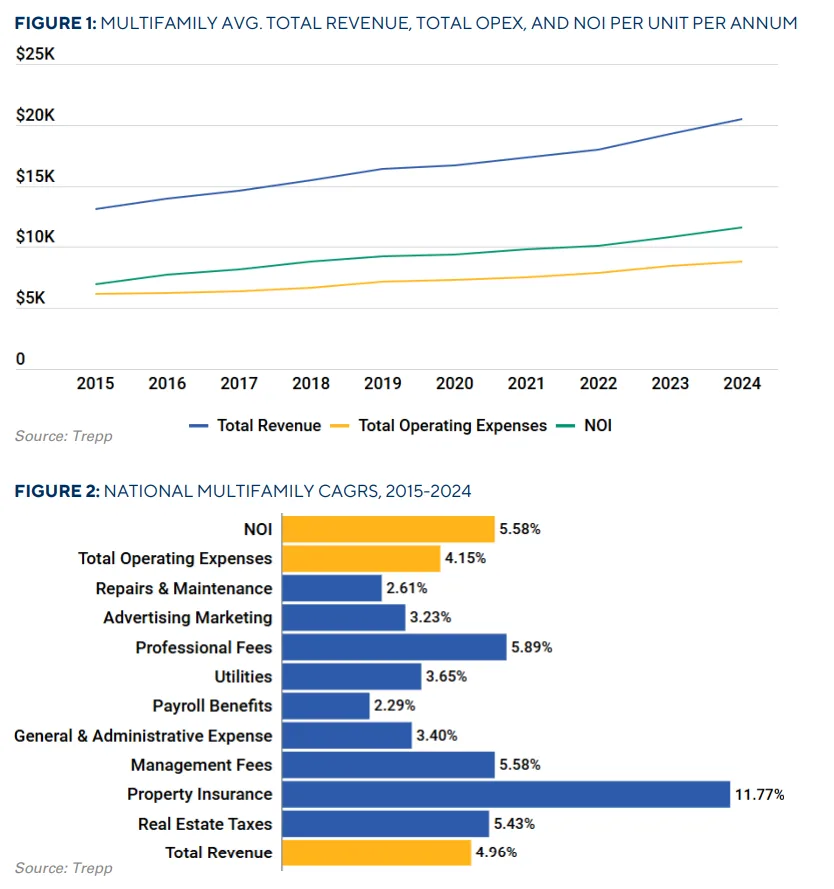
- From 2015 to 2024, nationwide multifamily operating expenses rose at a 4.15% CAGR, outpaced only slightly by revenue (4.96%) and NOI (5.58%). But beneath national averages lie sharp local spikes and critical line-item pressures.
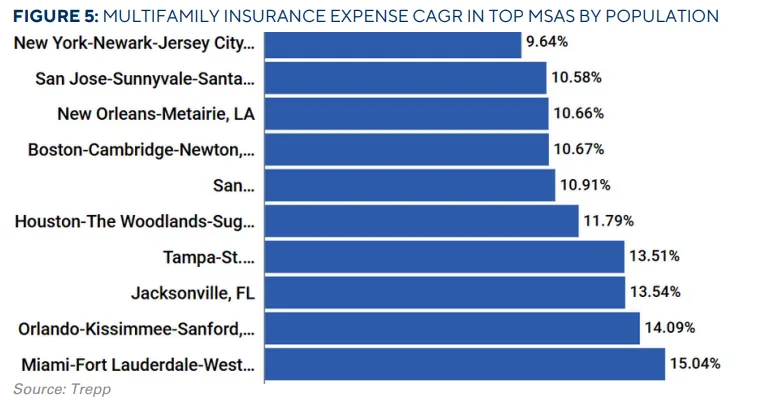
- Insurance premiums grew 11.77% annually—nearly tripling over the decade. Markets like Miami and the Inland Empire saw insurance costs rise over 250%, making it the top underwriting risk today.
- Buffalo topped the list with a 6.94% OpEx CAGR, driven by aging inventory and harsh winters. Florida metros like Tampa and Orlando saw costs climb due to storm risk and tax reassessments.
- High inflation in fixed costs like taxes (5.43% CAGR) and professional fees (5.89%) now demands granular underwriting. Deferred maintenance and outdated models are increasing portfolio-level risk.
A Squeeze Years in the Making
Multifamily assets have long been considered a stable and resilient real estate sector. But as Trepp’s latest benchmarking report reveals, rising operating expenses over the past decade have quietly shifted the calculus for owners, lenders, and investors.
From 2015 to 2024, operating expenses for securitized multifamily assets grew at a 4.15% compound annual growth rate, while NOI increased at a modestly higher 5.58% CAGR. But the growing gap between individual line-item costs and revenue growth tells a deeper story of risk redistribution—and of compressed margins in a capital-constrained market.
Insurance: The Sharpest Spike
The biggest driver of multifamily cost inflation has been property insurance. Nationwide, it posted a 172% increase over the decade—an 11.77% annual growth rate—outstripping all other expense categories. In risk-prone states like Florida and California, those numbers are even higher:
- Miami: Insurance rose 252.96% (15.04% CAGR)
- Orlando: +227.51% (14.09% CAGR)
- Tampa: +212.80% (13.51% CAGR)
- Inland Empire: +272.78% (15.74% CAGR)
This explosion in premiums—driven by increased disaster exposure, reinsurance shifts, and carrier pullouts—is challenging traditional underwriting assumptions.
Local Markets, Diverging Trends
While national averages offer a high-level view, the real story is in the local breakdowns. In Buffalo, NY—where operating costs jumped 6.94% annually—rising labor costs, older building stock, and brutal winters created a perfect storm of inflationary pressure. Other high-growth metros include:
- Inland Empire, CA: 6.84% OpEx CAGR
- Tampa, FL: 6.14%
- Orlando, FL: 6.03%
- Dallas, TX: 5.78%
These shifts have been driven by varied cost types: in Florida, it’s insurance and taxes; in Dallas and Austin, fixed costs and utility rate increases are the culprits.
Underwriting Headaches
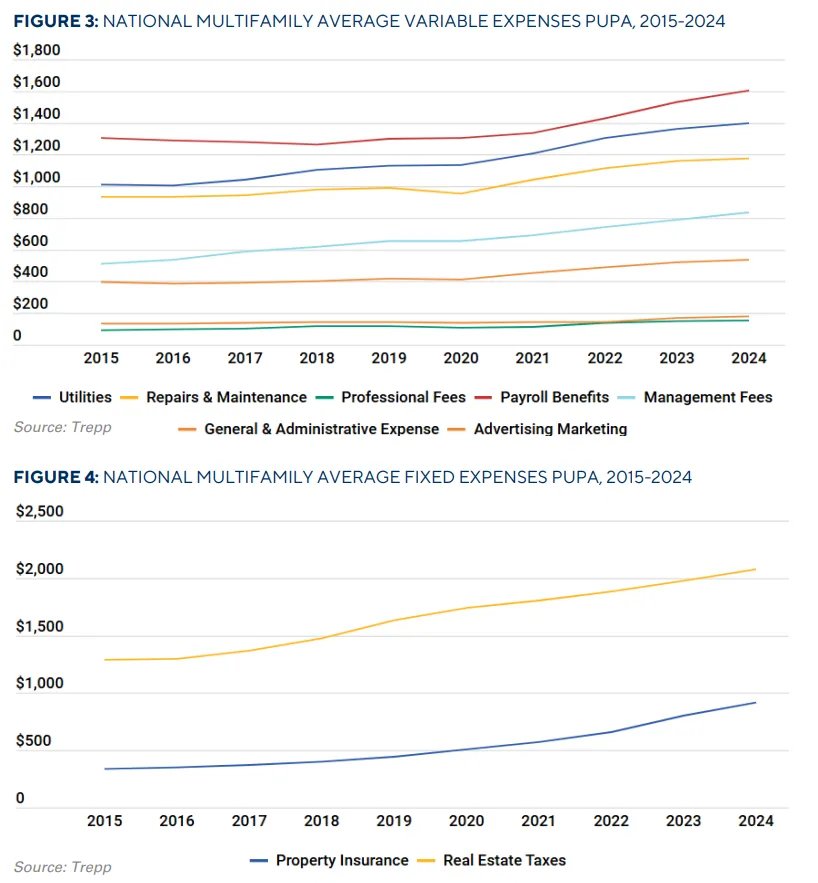
Many of these cost increases—particularly in fixed expenses like taxes and professional fees—were underwritten at lower inflation expectations. Trepp notes that in some metros, real estate taxes are climbing faster than rents.
Meanwhile, variable costs are creating additional noise in projections:
- Utilities: Grew at 3.65% nationally; exceeded 7% annually in the Inland Empire and Silicon Valley.
- Marketing: Jumped in lease-up-heavy markets like Charlotte and Phoenix.
- Payroll: Varied wildly; up 6.72% annually in Buffalo, down in NYC.
Implications for Lenders & Investors
From a lending perspective, the squeeze is showing up in the numbers. Average DSCRs have dropped from 1.6–2.0x pre-2021 to 1.35x in 2025, reflecting both higher costs and tighter margins. LTVs have dipped below 60% at their lowest point, and debt yields peaked above 18% in 2023.
Even as capital market conditions have slightly eased in 2025, the volatility in expenses—particularly for assets in climate-exposed, older, or high-growth regions—remains a key risk factor. According to Trepp, relying on standard 3–5% expense escalators is no longer sufficient.
Bottom Line
Trepp’s deep dive into a decade of multifamily expense trends reveals a structural shift in how OpEx is influencing underwriting, loan performance, and valuation. For dealmakers, investors, and lenders alike, the message is clear: granular, market-specific expense modeling is now essential.
Bracing for expense volatility—especially in areas prone to insurance, tax, and utility spikes—will define how well assets weather the next refinancing cycle.
Get Smarter about what matters in CRE
Stay ahead of trends in commercial real estate with CRE Daily – the free newsletter delivering everything you need to start your day in just 5-minutes