


- The gap between the highest and lowest multifamily cap rates among the top 30 US markets exceeds 200 basis points, signaling vastly different investor risk appetites across metros.rn
- At 3.88%, San Francisco’s cap rate reflects steep pricing and low yields, while Fort Lauderdale leads the pack at 6.27%, offering faster potential ROI.rn
- After a steady climb from their 2021 low of 4.1%, average US cap rates sit around 5.04%, with little change expected through year-end.
High Risk, High Reward?
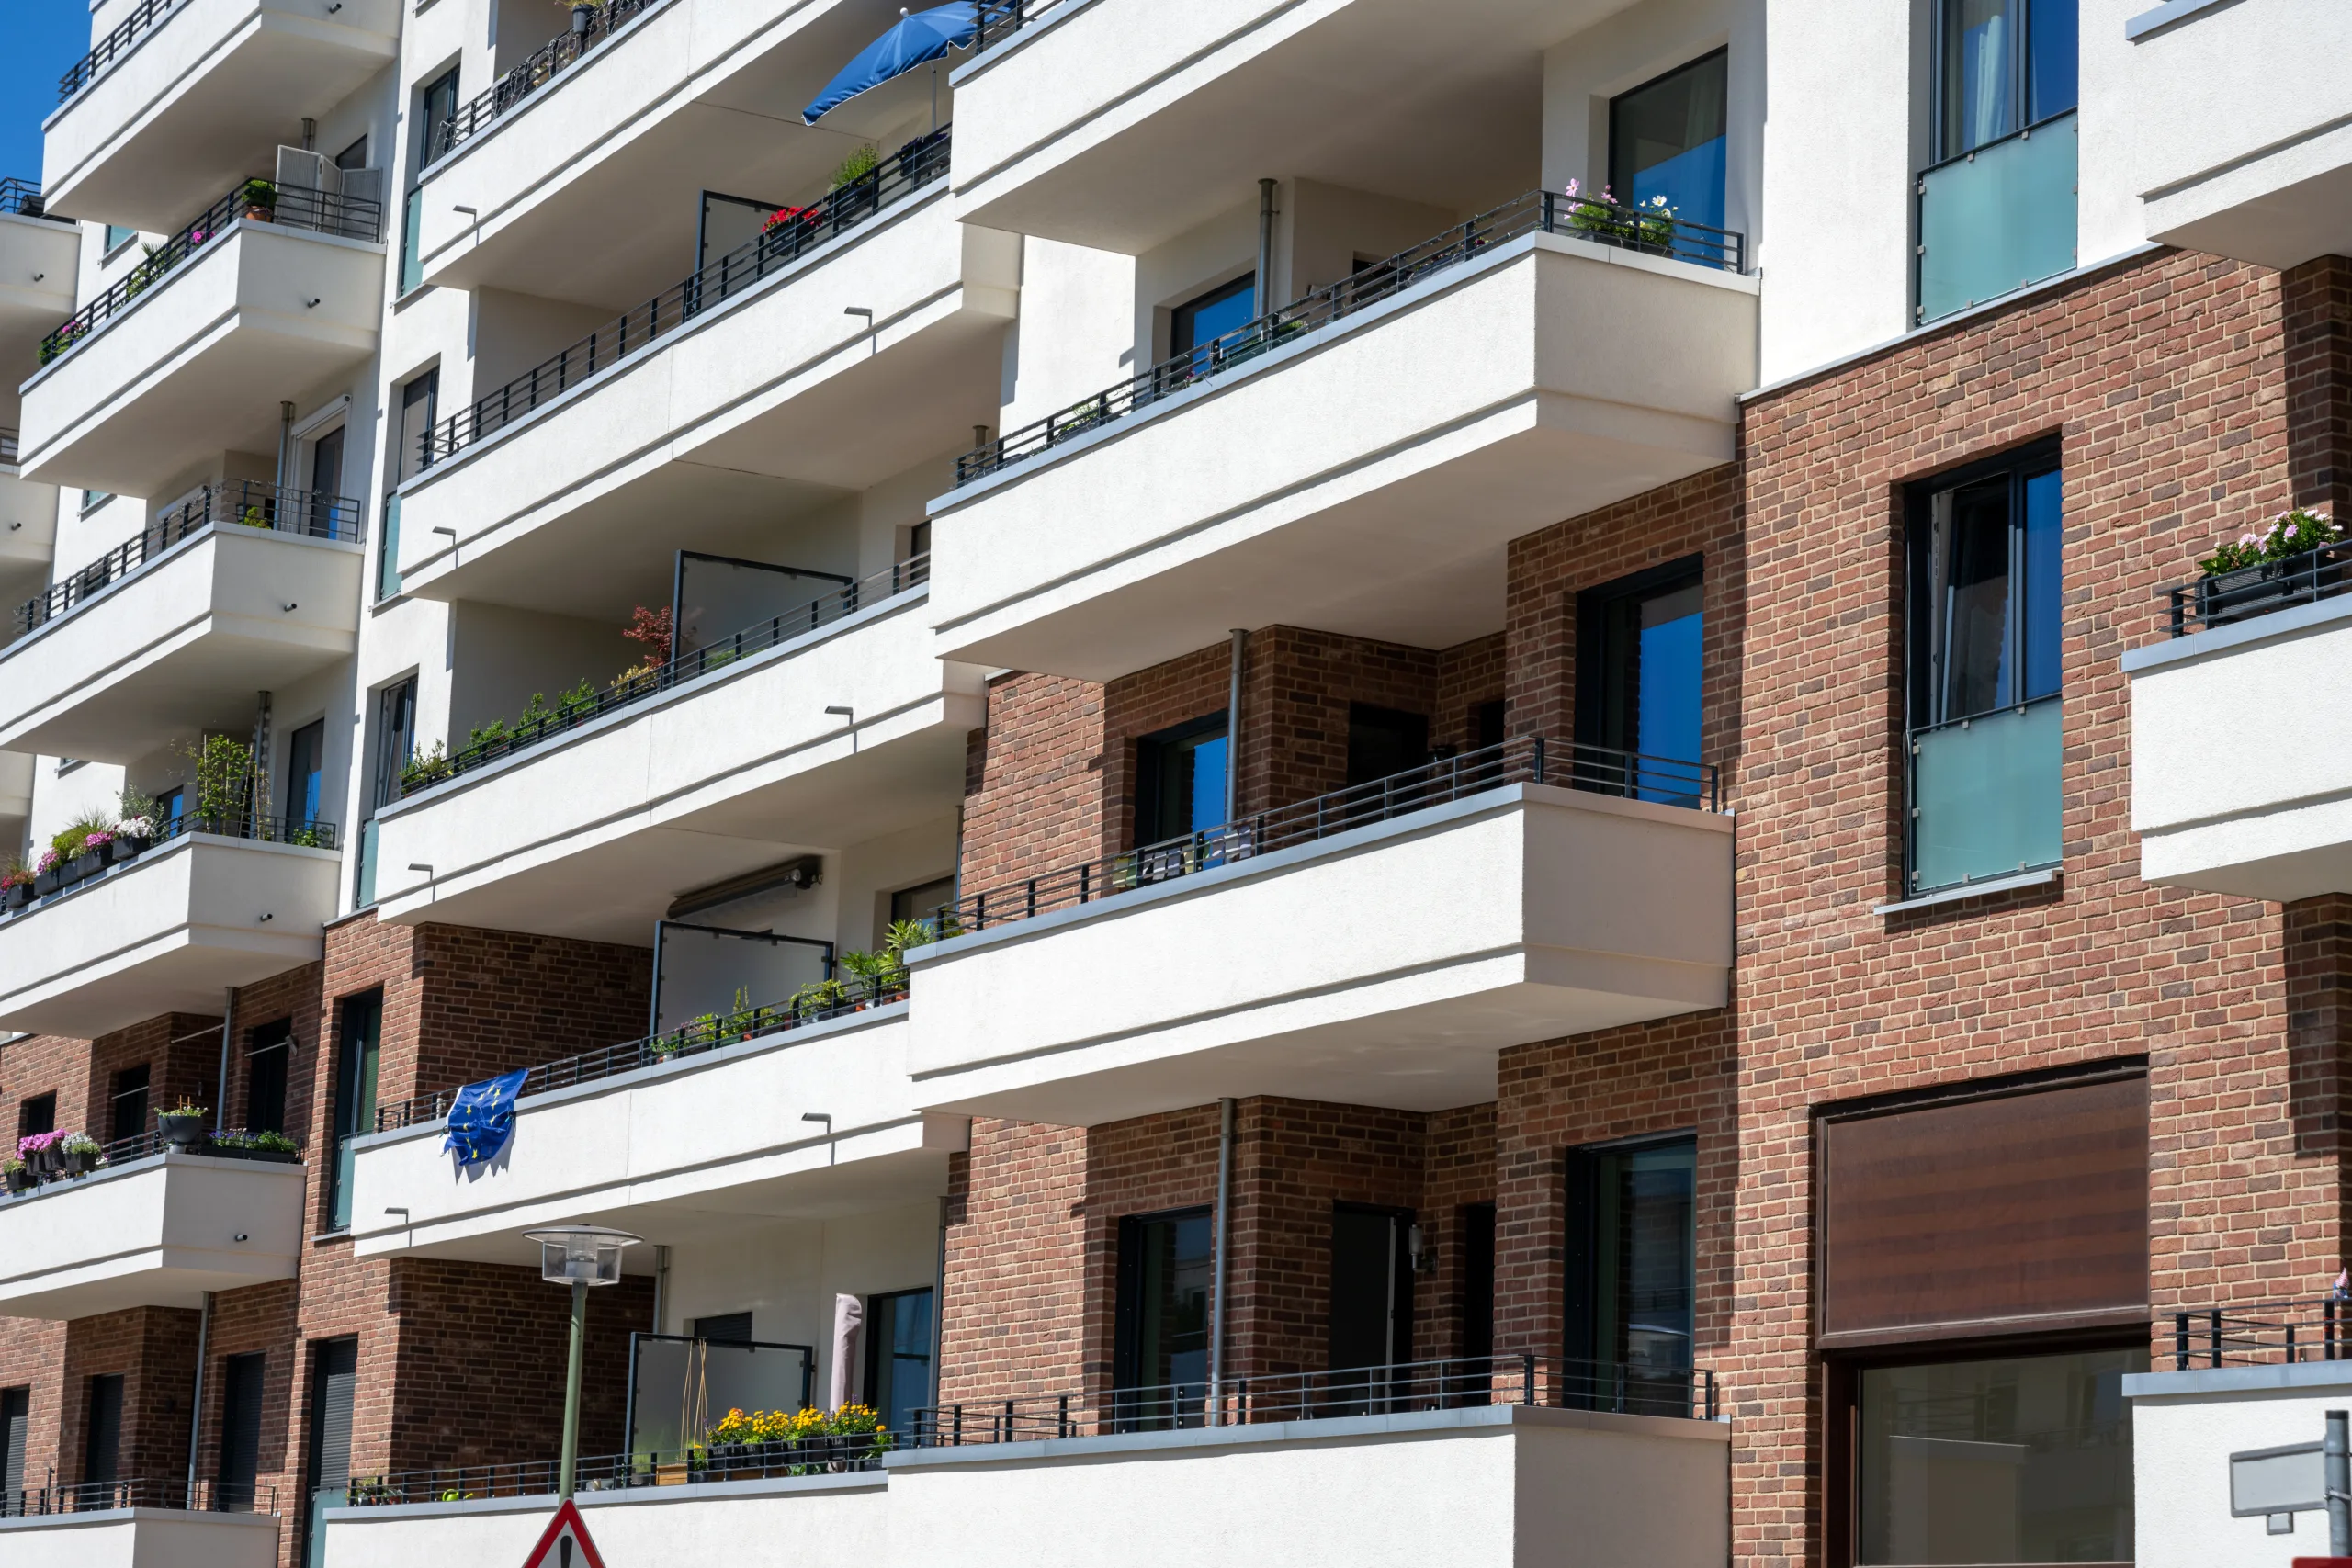
multifamily cap rates — which measure expected return by dividing a property’s net operating income by its sale price — offer a snapshot of investor sentiment in real estate markets. Lower rates often reflect higher competition and perceived market stability, while higher rates can indicate greater risk or softening fundamentals.
Among the 30 most active US multifamily markets, there’s a sharp divide, per Bisnow.
San Francisco’s Peninsula submarket, home to tech giants and affluent residents, boasts the lowest cap rate at 3.88%, meaning buyers would wait roughly 26 years to recoup their investment. On the opposite end, Fort Lauderdale’s cap rate sits at 6.27%, offering a quicker 16-year breakeven.
Market Activity Snapshot
According to Yardi Matrix, these 30 markets have seen 929 multifamily deals totaling $41B through September 2025, with an average cap rate of 5.04%. While that’s up from the historic low of 4.1% in 2021, rates have largely plateaued since 2023.
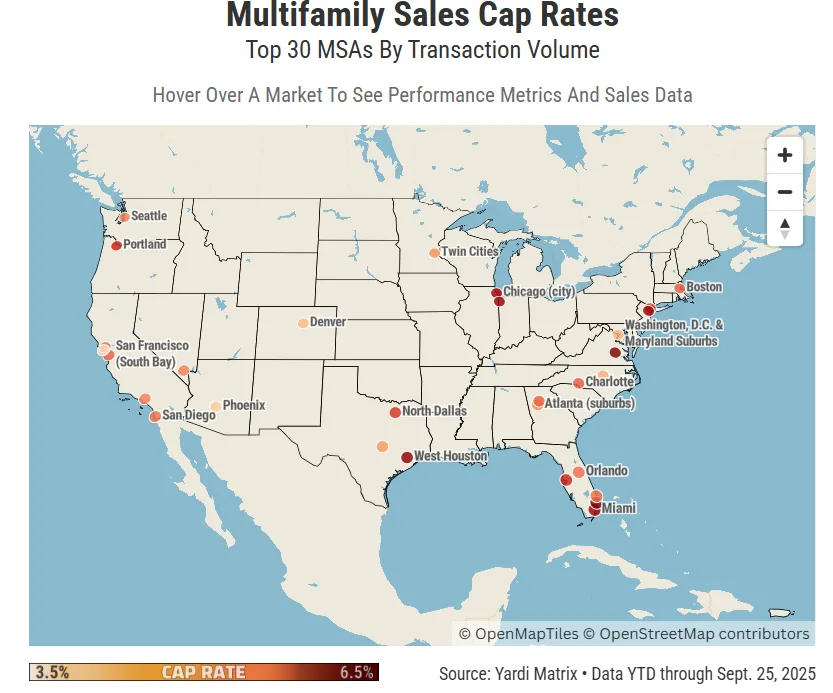
Markets such as Phoenix, with $3.3B in sales this year, highlight where investors remain active. But comparing regions is complicated — Yardi’s methodology includes entire regions like Washington, D.C., alongside fragmented city submarkets such as West Houston or Manhattan.
Signs of Stabilization
Despite persistent challenges — including inflation, high borrowing costs, and a softening job market — multifamily investment volumes are holding steady. Brokerage CBRE notes that most market watchers expect cap rates to remain flat through the end of 2025, with more anticipating a modest decline than a rise.
Avison Young reports private investors made up the bulk of buyers this year, while REITs have doubled their market share, rising from 3% of purchases in 2023 to 6% in 2025.
Get Smarter about what matters in CRE
Stay ahead of trends in commercial real estate with CRE Daily – the free newsletter delivering everything you need to start your day in just 5-minutes
Motivated Sellers, Not Always Distressed
While transaction volume is slowly rebounding, most sellers entering the market have a specific reason to offload properties — often tied to looming loan maturities, delayed stabilization, or pressure to reposition assets. Distress sales remain relatively rare, but urgency among some sellers is helping to close deals.
Why It Matters
Multifamily cap rates are a proxy for where investors see opportunity — or caution. The wide variation between markets like San Francisco and Fort Lauderdale reflects not just local demand and rent growth, but broader investor strategy in an uncertain macro environment.
With rates stabilizing and volume creeping upward, the cap rate map is as much about where money isn’t flowing as where it is.
What’s Next
Keep an eye on further REIT activity and whether economic headwinds prompt cap rates to adjust again. If inflation or borrowing costs ease, expect downward pressure on cap rates — but until then, investors will continue to scrutinize each metro’s risk profile with heightened precision.