


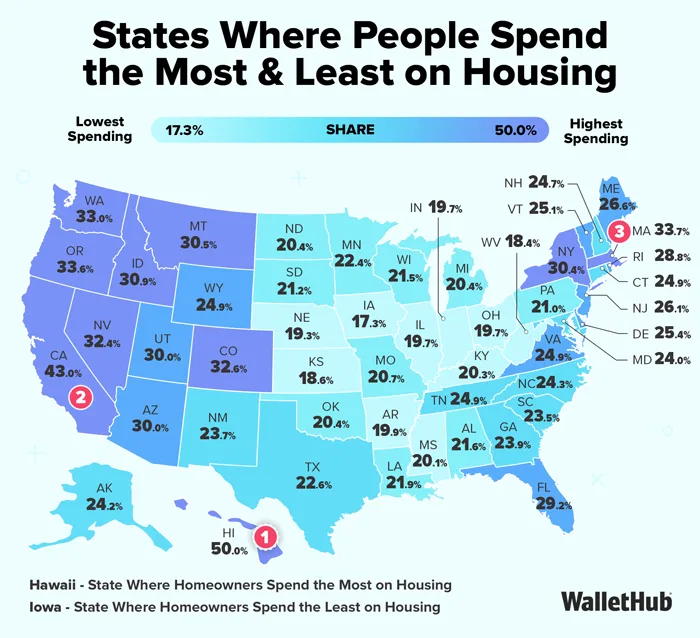
- Hawaii leads all states in housing costs, with homeowners spending about 50% of median income on housing.
- California and Massachusetts follow, with housing costs at 43% and 34% of median income, respectively.
- Iowa and Oklahoma residents experience the lowest housing cost burden, with spending under 18% and 21% of income.
- Renters in Hawaii and New York spend over 60% of income on housing, while Oklahoma renters spend just above 20%.
Housing Costs Widen Across US
The gap in housing costs by state continues to widen, according to a WalletHub study comparing mortgage, rent, and energy payments as a share of median income. Hawaii ranks highest: homeowners there spend 50% of their monthly incomes on housing, and renters devote a staggering 63%. California and Massachusetts follow closely for homeowners, with costs exceeding 33% of income. Meanwhile, the lowest housing burdens are found in Iowa for homeowners (17%) and Oklahoma for renters (20%).
Homeowner and Renter Impact
For homeowners, expensive states include Hawaii (50.02%), California (43.00%), and Massachusetts (33.67%), all significantly above the national average. These states also have some of the highest utility costs, compounding overall expenses. Conversely, states such as Iowa (17.26%), West Virginia (18.39%), and Kansas (18.64%) offer the lowest homeowner burdens as a percentage of median income.
Renters face steeper challenges in certain states: Hawaii (62.52%), New York (61.28%), and Maine (52.72%) top the list, while more affordable states include Oklahoma (20.29%) and Iowa (20.95%). Income alone does not offset the effect of high costs in states like Hawaii or California, where elevated home prices and utilities outweigh strong median salaries. This divergence has started to show up in leasing trends as well, with renter demand accelerating faster than homeownership in several markets where affordability pressures remain elevated.
Get Smarter about what matters in CRE
Stay ahead of trends in commercial real estate with CRE Daily – the free newsletter delivering everything you need to start your day in just 5-minutes
State-by-State Disparities
The difference in housing costs across states highlights geographic affordability challenges. High-rank states combine pricey mortgages with above-average energy costs, while low-burden states benefit from moderate mortgage payments and lower utility bills. The result: starkly different household budget impacts and barriers to homeownership depending on location.
Why It Matters
Persistent gaps in housing costs drive regional economic pressures, impacting residential stability and spending power. As mortgage rates and household expenses fluctuate, effective budgeting and local cost awareness remain critical for US households seeking financial stability in a shifting housing landscape.