



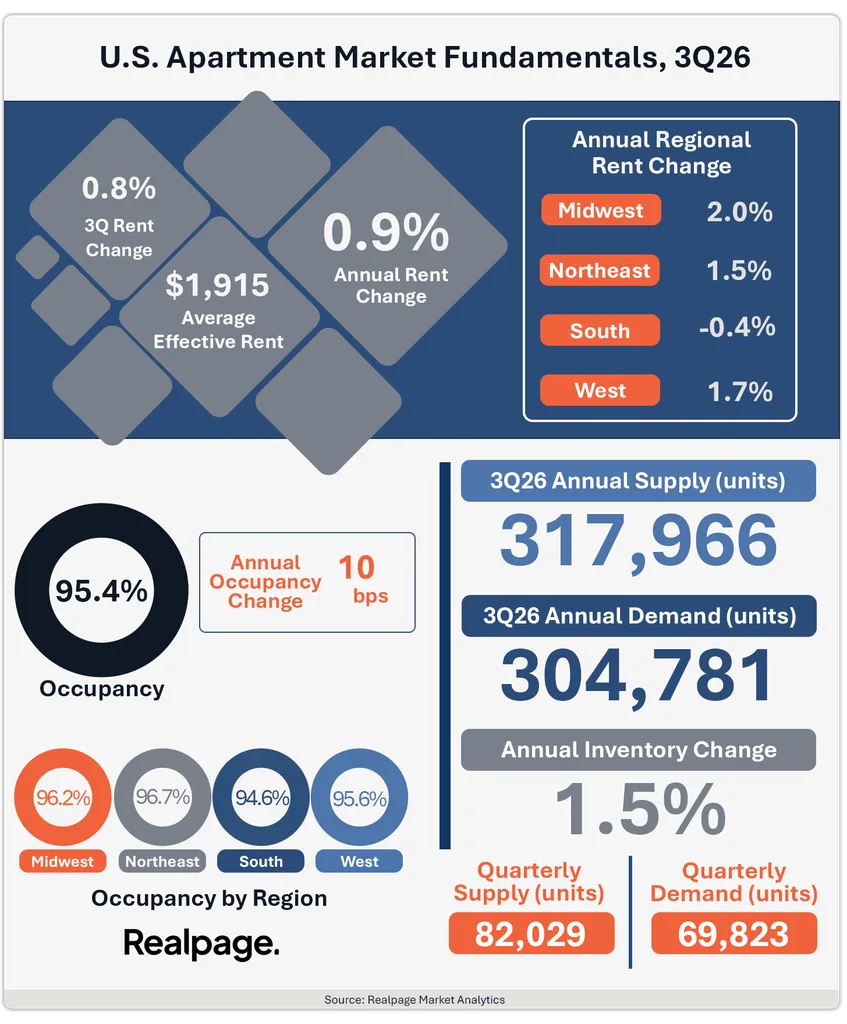
- Renters absorbed nearly 304,800 apartments in the year ending Q3 2026 while developers completed nearly 318,000, leaving a 13,000-unit gap that is the narrowest since late 2015.
- Same-store effective rents rose 0.9% year over year to $1,915, the first annual gain since Q2 2025, and occupancy held at 95.4%, up 10 basis points from a year ago.
- Rent growth is split by region: San Francisco and the Midwest lead, while Sun Belt markets such as San Antonio, Denver, Charlotte, Tampa and Houston still cut rents.
U.S. apartment demand is closing in on a cooling supply wave, according to RealPage Market Analytics. Renters absorbed nearly 304,800 conventional apartments in the year ending Q3 2026.
That is up from the Q2 showing but well below the record pace of more than 780,000 units in Q2 2025.
Get Smarter about what matters in CRE
Stay ahead of trends in commercial real estate with CRE Daily – the free newsletter delivering everything you need to start your day in just 5-minutes
Supply Wave Recedes
Developers completed nearly 318,000 units in the year ending Q3, about 46% below the late-2024 peak of nearly 588,000. The gap between demand and supply is now just 13,000 units, the narrowest since late 2015.
Third-quarter leasing itself was soft. Renters absorbed about 69,800 units from July through September, ahead of Q3 2025 but well behind the decade average for the season, in part because fewer vacant units remain to fill.
Occupancy Holds, Rents Turn Positive
Occupancy averaged 95.4% in Q3, unchanged from Q2 and 10 basis points above a year earlier. It was the first positive year-over-year occupancy change in a year.
Same-store effective asking rents rose 0.9% year over year, the first annual gain since Q2 2025. The average effective rent reached $1,915.
Rents rose 0.8% in Q3 after a 1.8% increase in the first half. Concessions faded slightly, with about 22.7% of apartments offering them at an average of 7.5%.
Coastal Tech Hubs and the Midwest Lead
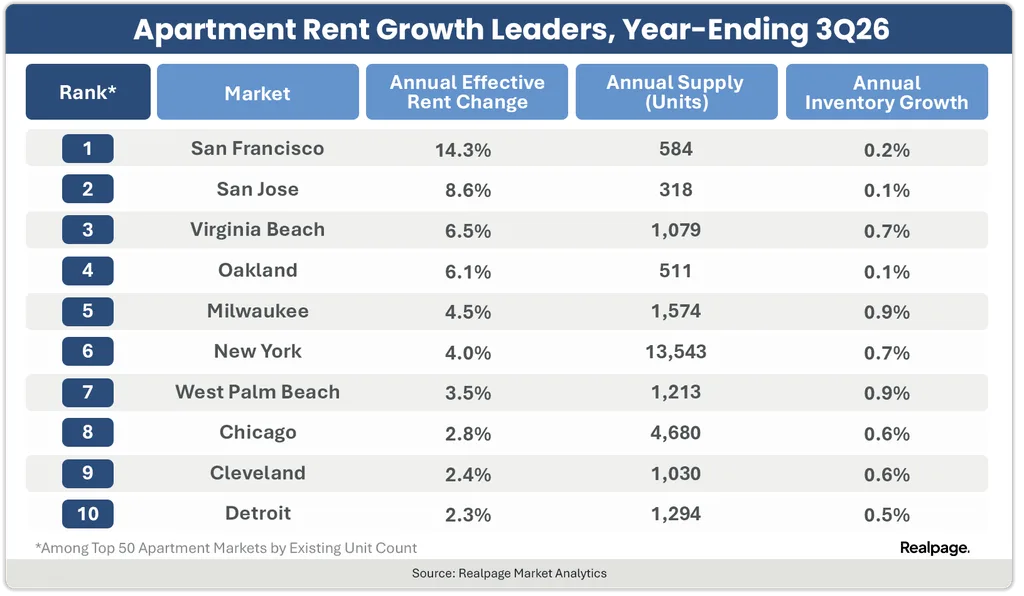
San Francisco led with rents up 14.3% over the year and 5.6% in Q3 alone. San Jose and Oakland followed with annual gains of 6% to 9%, and Virginia Beach rose 6.5% on the highest occupancy among the 50 largest markets at 97.7%.
New York’s annual rent growth moderated to 4%, though demand there still outpaces new supply. The Midwest led all four regions at 2%, with Milwaukee, Chicago, Cleveland and Detroit among its top performers.
Sun Belt Still Absorbing Supply
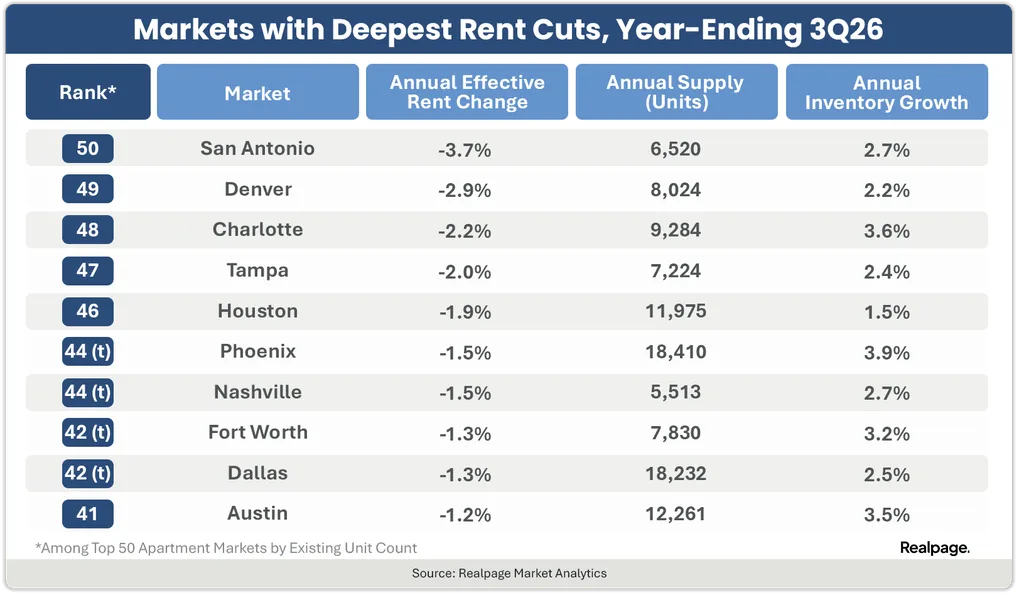
The South was the only region with annual rent cuts and the only one with occupancy below 95%. San Antonio saw the steepest decline among large markets, with rents down 3.7% and occupancy at 93.1%.
Denver, Charlotte, Tampa and Houston posted annual losses of roughly 2% to 3%. Phoenix and Austin narrowed their annual cuts to less than 2% and both posted rent growth from July through September.
Why It Matters
With supply falling faster than demand, owners are regaining some pricing power. The easing of apartment concessions fits that pattern.
The split between coastal and Sun Belt markets also means national averages hide very different operating conditions for owners and lenders.
What’s Next
RealPage describes the market as settling toward a more balanced pace as new supply cools. Watch whether Q4 absorption holds up in the Sun Belt markets that are starting to see rent growth, since their recovery would broaden the national gain.