




- The Bronx now leads New York City in both annual rent growth and recent momentum, while Manhattan and Brooklyn remain well above the US average.
- NYC metro rents rose 4.3% year over year through August versus 2.7% nationally, and three-month annualized growth reached 5.2% compared with 4.1% nationwide.
- Tenants priced out of Manhattan and Brooklyn are pushing demand into more affordable boroughs, spreading rent pressure into supply-constrained Bronx neighborhoods.
The Bronx now leads New York City in both annual rent growth and recent momentum, according to Chandan Economics’ September 2026 Rent Growth Monitor. NYC rent growth across the metro area reached 4.3% year over year through August, compared with 2.7% nationally.
Manhattan and Brooklyn also remain firmly above the US average, extending the city’s lead over national rent trends.
Get Smarter About What Matters in New York
Subscribe to our free newsletter covering the biggest commercial real estate stories across the five boroughs — delivered in just 5 minutes.
Two Ways to Measure NYC Rent Growth
Chandan publishes the monitor monthly, breaking out rent performance across Manhattan, Brooklyn, Queens, the Bronx, and Staten Island. It tracks two measures: year-over-year growth and a three-month average annualized rate that captures the more recent direction of rents.
The data comes from Zillow’s Observed Rent Index (ZORI), a smoothed, seasonally adjusted measure. Because Zillow revises the index, individual readings can shift in later releases.
The Details
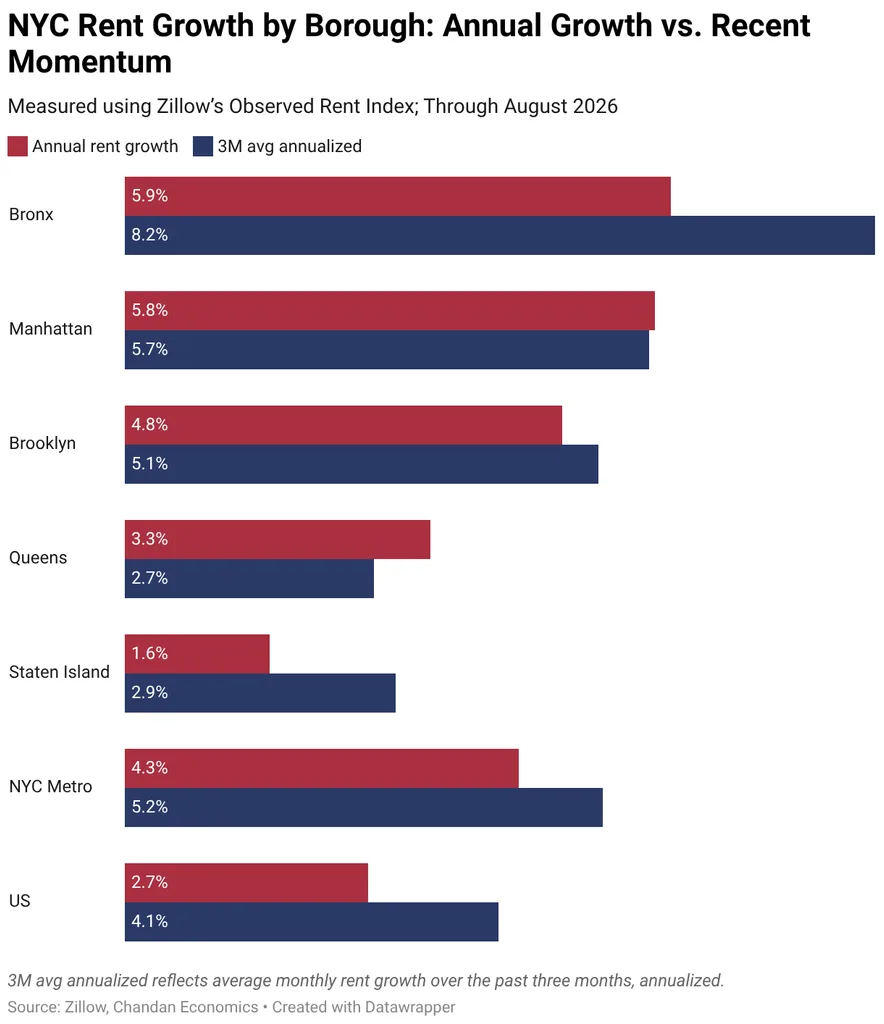
On an annual basis, the Bronx led with 5.9% rent growth, narrowly ahead of Manhattan at 5.8%. Brooklyn followed at 4.8%, Queens posted 3.3%, and Staten Island trailed at 1.6%.
Recent momentum tells a similar story. Three-month annualized rent growth hit 5.2% across the NYC metro, versus 4.1% nationally, with the Bronx running at an 8.2% pace, Manhattan at 5.7%, and Brooklyn at 5.1%.
Staten Island remains the softest borough on an annual basis. However, its 2.9% momentum reading points to stabilization rather than further weakening, per Chandan.
Affordability Spillover Hits the Bronx
Chandan attributes the Bronx’s lead to affordability spillover. With Manhattan and Brooklyn rents still elevated, renters are shifting demand to comparatively affordable boroughs, particularly in neighborhoods and unit types where supply is limited.
Manhattan’s strength reflects a different driver: a renewed proximity premium as the office market improves and dense employment hubs regain importance. Even as rent growth broadens across other major US metros, NYC continues to run well ahead of the national average.
Why It Matters
Chandan ties NYC’s rent-growth advantage to a combination of resilient demand and constrained supply. For multifamily owners, that supports pricing power across most of the city, while renters now face rising costs well beyond Manhattan and Brooklyn.
The report cautions that growth isn’t uniform across the Bronx. Still, the data adds weight to the housing supply debate at City Hall, where Mamdani’s housing plan has been winning over once-skeptical industry players.
What’s Next
Chandan’s next monthly release will show whether the Bronx’s 8.2% momentum holds or begins to cool. Watch Staten Island for confirmation that its stabilization is real.
Manhattan’s trajectory will likely track the office recovery. If high-density job centers keep gaining ground, the proximity premium Chandan describes could keep Manhattan rents near the top of the borough rankings.