





- Bank-held multifamily delinquencies fell to 1.41% in Q2 2026 from a multi-year high of 1.47% in Q1.
- Early-stage delinquencies improved, but 90-plus-day delinquencies rose to 1.10% and annualized net charge-offs reached 0.32%.
- CRED iQ property data showed operating expenses growing faster than income at the median securitized multifamily property.
CRED iQ’s Q2 analysis of bank multifamily credit found that delinquencies eased to 1.41% from 1.47% in Q1. The FDIC-based data cover all insured institutions. Bank multifamily portfolios grew 3.6% year over year to $667.6B, while delinquent loan balances fell to $9.41B from $9.78B.
Get Smarter about what matters in CRE
Stay ahead of trends in commercial real estate with CRE Daily – the free newsletter delivering everything you need to start your day in just 5-minutes
Headline Relief Masks Deeper Stress
The improvement was concentrated in earlier-stage trouble. Loans 30 to 89 days delinquent fell to 0.31% from 0.40%. However, 90-plus-day delinquencies increased to 1.10% from 1.07%. Net charge-offs also rose to an annualized 0.32%, more than double the 0.13% banks charged off during all of 2025. CRED iQ described that combination as consistent with a workout-driven cycle rather than a fully resolving one.
The Q2 delinquency rate is still about 6.7 times the 2019 low of 0.21%, though it remains well below the 5.90% Global Financial Crisis peak. The dollar value of delinquent loans fell during the quarter even as the most serious delinquency bucket moved higher. That divergence is another reason the headline rate does not capture the full credit picture.
The Details
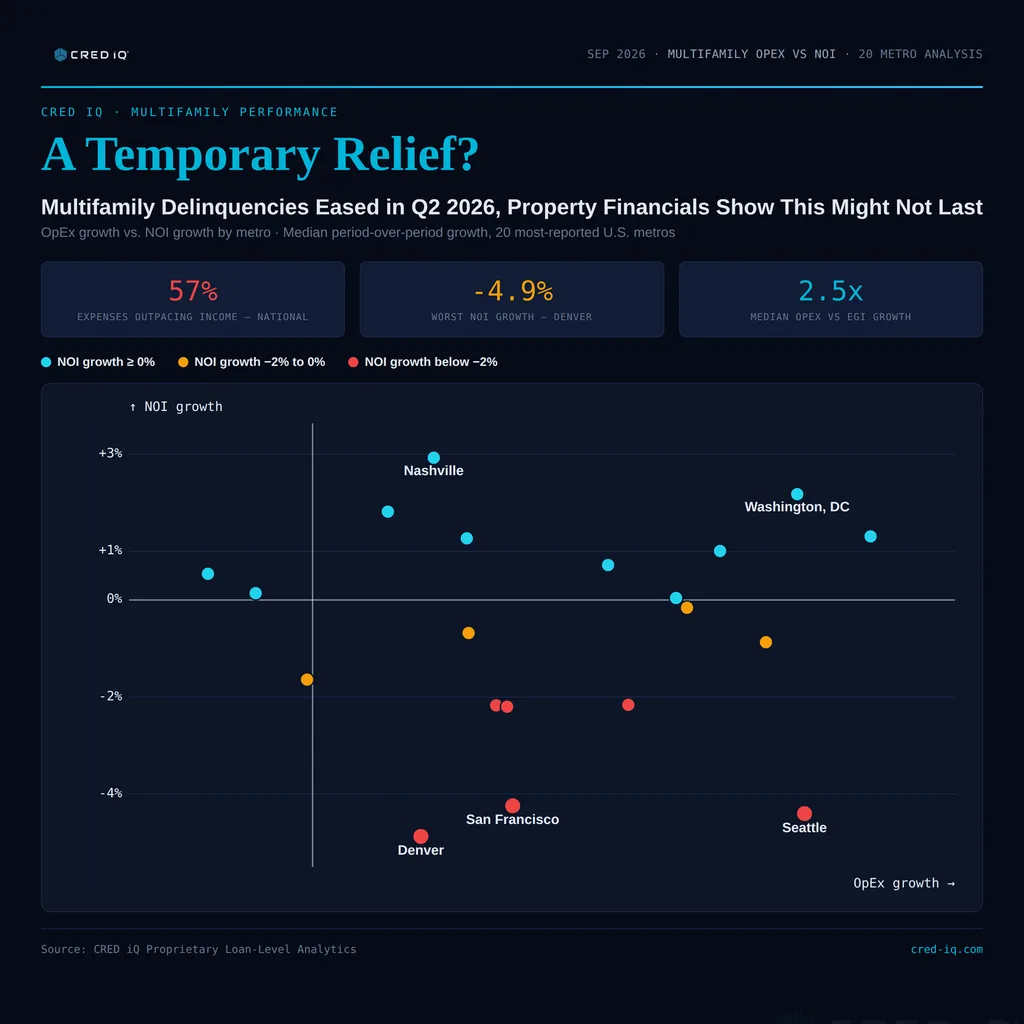
Property-level results help explain why the headline improvement may prove fragile. CRED iQ separately analyzed securitized multifamily loans with updated financials reported in June 2026. At the median property, effective gross income increased 0.6%. Operating expenses grew 1.5%, or about 2.5 times as fast. NOI rose only 0.2%. Expenses outpaced income at 57% of properties, and 48% recorded an outright NOI decline. That multifamily NOI pressure can reduce the cushion available for rate resets or maturity refinancing. A loan with weakening cash flow has less room to absorb higher debt costs or tighter proceeds tests.
Regional Pressure Is Uneven
Denver, Seattle and San Francisco showed the weakest combination of trends in the property dataset. Those markets paired below-average income growth with above-average expense growth, producing the sharpest NOI erosion in the sample. Dallas and Austin showed a different pattern.
There, NOI softness was linked more closely to weak income growth than rising costs, pointing to demand-side pressure rather than an expense-driven squeeze. CRED iQ stressed that its securitized property dataset is separate from the FDIC universe of bank-held multifamily loans. The contrast matters because similar NOI weakness can arise from different operating causes. In one group of markets, expenses are doing more damage. In the other, weak revenue growth is the larger problem.
Why It Matters
Q2 delivered a genuinely mixed signal for multifamily credit. The headline delinquency rate improved. However, later-stage delinquencies and realized losses continued to rise. At the property level, expenses are still outpacing income at the median asset. NOI is also flat or falling across a large share of the sample.
That combination limits the operating cushion available when loans reset or mature. It also means a falling delinquency rate alone does not establish that the credit cycle has turned. The FDIC and securitized datasets cover different loan universes, but both point to continued pressure beneath the headline improvement.
What’s Next
CRED iQ identified Denver, Seattle and San Francisco as markets to watch heading into Q3 because income and expense pressure are compounding there. The next bank call reports will show whether 90-plus-day delinquencies and charge-offs continue to climb. Updated property financials will also indicate whether income can begin outpacing expenses.
CRED iQ said those two datasets together will determine whether Q2 marked a real inflection point or only a one-quarter pause. CRED iQ said the next quarter’s bank call reports and property fundamentals will determine whether Q2 was a true inflection point or a temporary pause.