




- Austin’s office vacancy declined to 20.6% in Q2 2026, down from 21.2% the previous quarter, per Colliers.
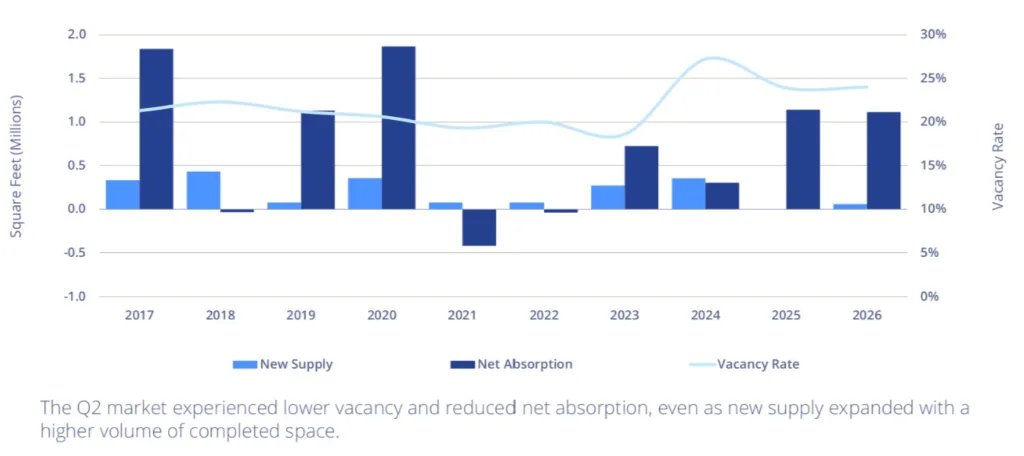
- Net absorption remained positive with 735.3k SF, while rents softened to $44.79 PSF and new supply increased.
- Stabilization continues, but competitive pricing signals ongoing tenant leverage and shifting market power.
Steady Market Improvement Amid Pressures
Austin’s office sector faced another turbulent quarter, but Q2 2026 brought signals of gradual stabilization. Colliers reports that overall vacancy edged down to 20.6%, marking a modest drop from 21.2% in Q1 and staying below the market’s peak a year earlier. Although tenant activity softened, net absorption rebounded into positive territory, reversing last year’s negative trends. Meanwhile, asking rents continued to face downward pressure, reflecting landlord concessions and a fiercely competitive tenant landscape.
With new supply deliveries totaling 279.3k SF in Q2—up sharply from 78.1k SF in Q1—the market absorbed additional space without a spike in vacancy. Net absorption clocked in at 735.3k SF for the quarter, supporting the narrative that demand, while muted, is holding steady as businesses weigh their expansion and flexibility options.
Get Smarter About What Matters in Texas
Subscribe to our free newsletter covering the biggest commercial real estate stories across Texas — delivered in just 5 minutes.
The Details
Austin’s total office inventory reached 91.9M SF at midyear, while construction activity continued declining. Under-construction volume fell to 459K SF from 1.7M SF at the end of 2025. Average asking rents settled at $44.79 PSF, down from $45.53 PSF in Q1. Class A CBD space commands $64.65 PSF, while broader Class A space averages $54.88 PSF.
Active leasing included Texas Capital Bank’s 27,012 SF commitment in the Warehouse District. Several other transactions ranged between 17K SF and 25K SF. Meanwhile, 12708 Riata Vista Cir traded for $197 PSF, covering 71,247 SF in the Northwest submarket.
Sublease availability represented about 3% of total inventory, while direct availability approached 19%. Landlords across several submarkets offered lower rents and aggressive incentives to attract tenants. These strategies remained especially common in the CBD, East, and South.
Supply and Absorption Find Equilibrium
Austin’s Q2 2026 numbers show stabilization rather than a dramatic recovery. That marks progress from 2023 and the uneven expansion during 2024 and 2025. Overall net absorption declined from 1.1M SF in Q1 but remained positive for a fourth consecutive quarter. The trend suggests Austin continues working through its glut of available office space.
Source: Colliers
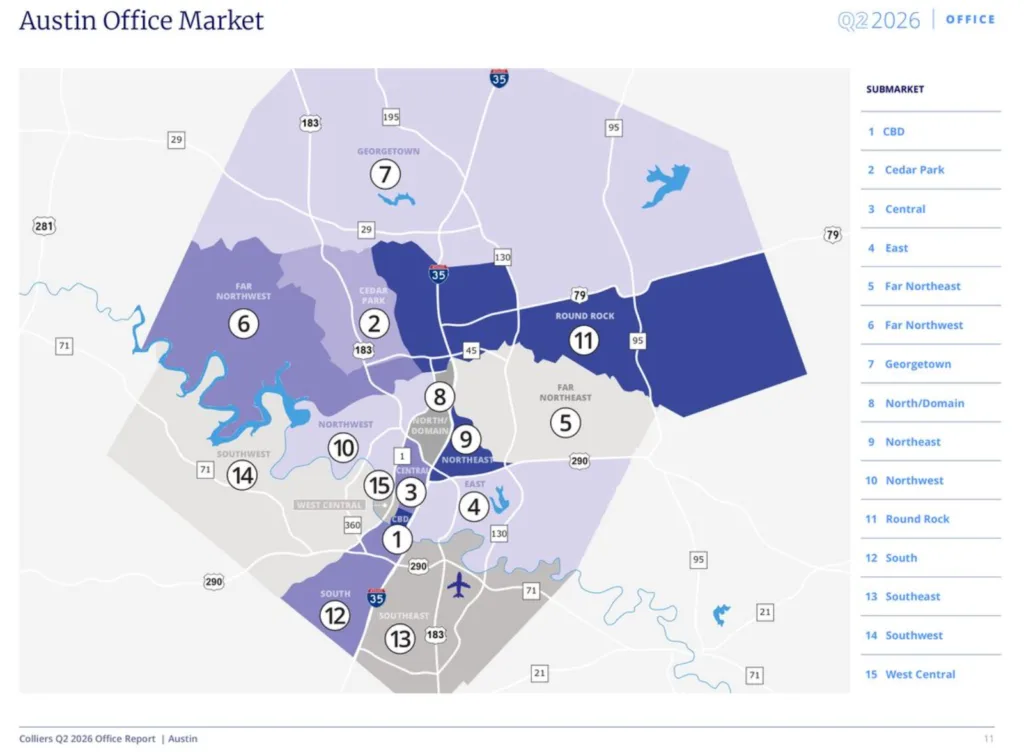
Performance also varies significantly across submarkets. The Northwest and Southeast recorded strong absorption, while the East posted a 35.3% vacancy rate. The South also remained challenged, with vacancy reaching 30.5%.
Class A space continues outperforming lower-quality properties on absorption. However, premium rents and widespread concessions show landlords are resetting expectations under current economic pressures. Landlords are increasingly using concessions and lower effective rents to secure occupancy.
Why It Matters
Austin serves as a bellwether for fast-growing US metros navigating hybrid work and broader economic headwinds. Colliers’ Q2 2026 report shows Austin moving beyond its cyclical trough. Vacancy reached 20.6%, down significantly from 22.3% one year earlier. The market also recorded 735K SF of net absorption.
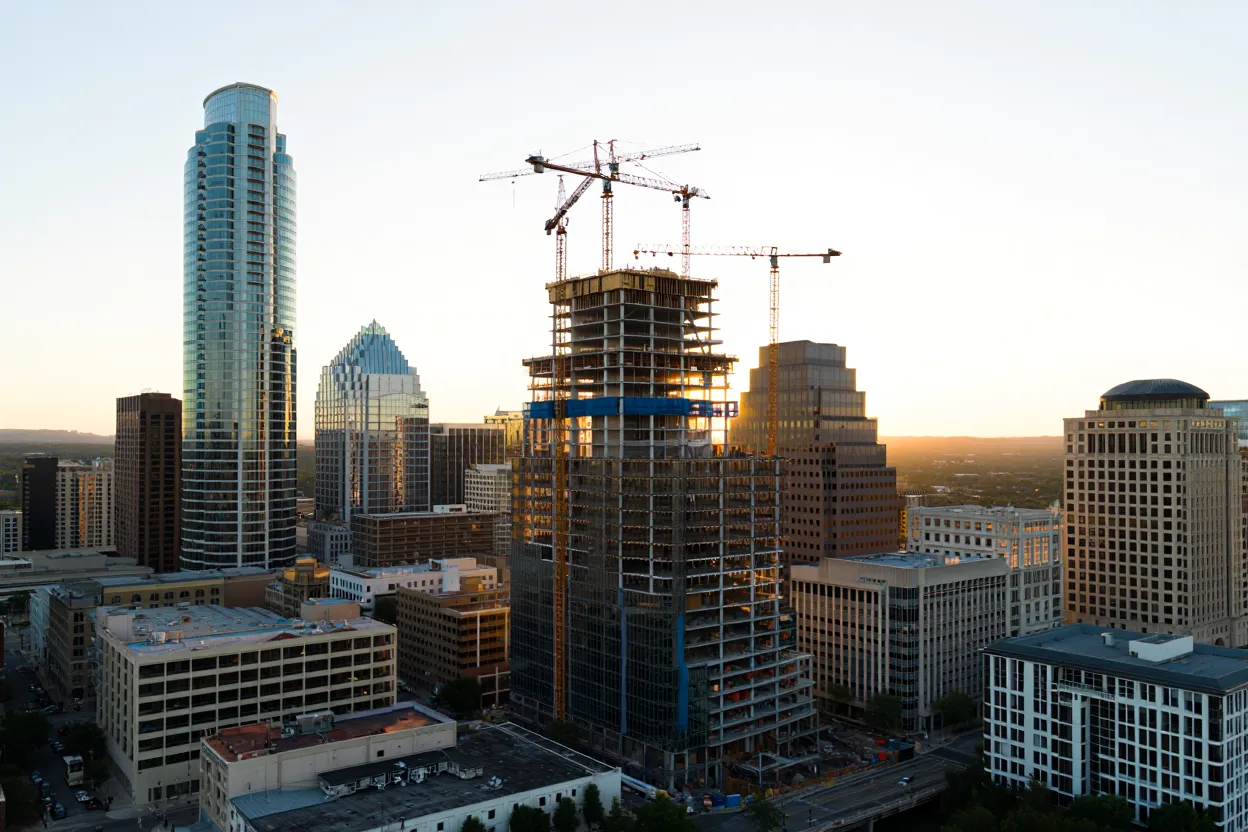
Austin’s improvement also mirrors broader office momentum, as Colliers reported US leasing activity increased 32% during Q2. Positive absorption alongside falling rents suggests landlords are finding pricing levels that stimulate demand. Only 459K SF remains underway, significantly reducing future supply pressure. This cooling should help align new supply with absorption and limit additional vacancy risk.
Still, tenant-friendly conditions will not disappear quickly. Asking rents have declined, while persistent sublease availability keeps pressure on landlords. The CBD remains particularly soft, with 29.1% vacancy and negative net absorption. Owners will need flexible lease terms and creative dealmaking as competition for qualified tenants continues.
What’s Next
Austin’s development pipeline should narrow further, with only 459K SF currently under construction. That represents the lowest construction volume in years. Fewer new starts should moderate future vacancy and support rent stabilization as demand gradually improves.
Continued business growth and Austin’s technology ecosystem could support additional absorption. However, broader economic conditions will influence the recovery. Companies’ evolving office strategies will also shape long-term demand.
For CRE stakeholders, Austin has become a test case for post-pandemic office recalibration. New supply is slowing, but landlords must still compete through pricing, concessions, and amenities. Austin’s innovation-driven economy provides support as tenants reconsider how and where employees work.