


- Commercial property price signals diverge, with RCA CPPI reporting national gains and CoStar’s CCRSI capturing declines in May 2026.
- Index methodology and market segment focus explain the differences; office remains the weakest sector, with significant distress evident in some recent trades.
- For CRE executives, understanding both indexes is crucial for risk management and capital allocation in a shifting, uneven recovery.
Mixed Messaging from Major Indexes
CRE executives are contending with contradictory signals on US property pricing. Globe St reports that MSCI’s RCA CPPI All-Property Index logged a 1.6% year-over-year gain in May 2026, supported by modest monthly growth. This data paints a picture of a nationwide market gradually rebounding, even as borrowing costs remain elevated and Federal Reserve projections boost the chance of further rate hikes by year end.
Meanwhile, CoStar’s Commercial Repeat Sales Indices (CCRSI) tell a different story, showing drops of 0.6% and 1.3% from April in its value-weighted and equal-weighted measures, respectively—the first time in 2026 both have fallen simultaneously. The disconnect underscores the importance of index construction and market coverage when evaluating CRE trends.
Get Smarter about what matters in CRE
Stay ahead of trends in commercial real estate with CRE Daily – the free newsletter delivering everything you need to start your day in just 5-minutes
The Mechanics Behind the Divergence
RCA CPPI and CCRSI both use repeat-sales methodology. They track properties with multiple sale dates to measure price changes. RCA CPPI aggregates national price movements across sectors. It uses late 2006 as its benchmark. That approach smooths volatility and provides a broad market view.
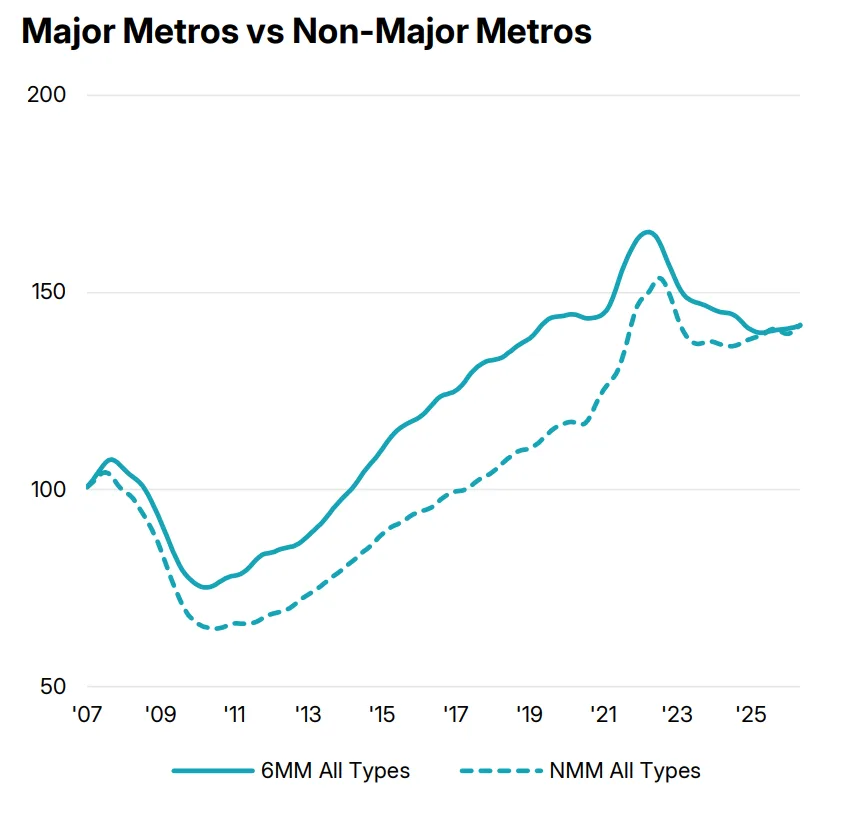
By contrast, CCRSI splits into value-weighted and equal-weighted series. The value-weighted index emphasizes large urban deals. The equal-weighted series tracks smaller properties in secondary and tertiary markets. As a result, CCRSI better reflects active transactions and local conditions. Consequently, RCA CPPI can show steady national growth while CCRSI highlights declines. Distressed sales and weak office trading often drive those declines.
Source: MSCI Inc.
Office Weakness Amplifies Index Discrepancies
Office properties remain the biggest source of divergence. CoStar reported further declines across both large and small office deals in May. The value-weighted CCRSI sits 16.4% below its July 2022 peak. Meanwhile, the equal-weighted index stands 1.9% below its March high.
Distressed repeat sales remain limited. Only 25 of 1,355 repeat sales qualified as distressed in May. However, those deals can sharply reduce market values. The 3000 Post Oak office tower in Houston illustrates that trend. Lenders foreclosed on the property for $10.5M. It lost $159.5M from its 2014 sale price. Meanwhile, RCA CPPI shows suburban office prices rose 4.6% year over year. CBD office also posted slight gains. Still, CBD office prices remain about 50% below their 2022 peak.
Why It Matters
The gap between RCA CPPI and CCRSI highlights today’s complex investment landscape. RCA CPPI rose 1.6% year over year and 0.4% month over month. Those gains suggest a gradual national recovery. However, CCRSI reveals where pricing pressure remains strongest. It also shows how a handful of distressed deals can skew transaction-based indexes. That uneven pricing also mirrors the broader CRE recovery, where capital and performance continue to diverge across sectors and markets.
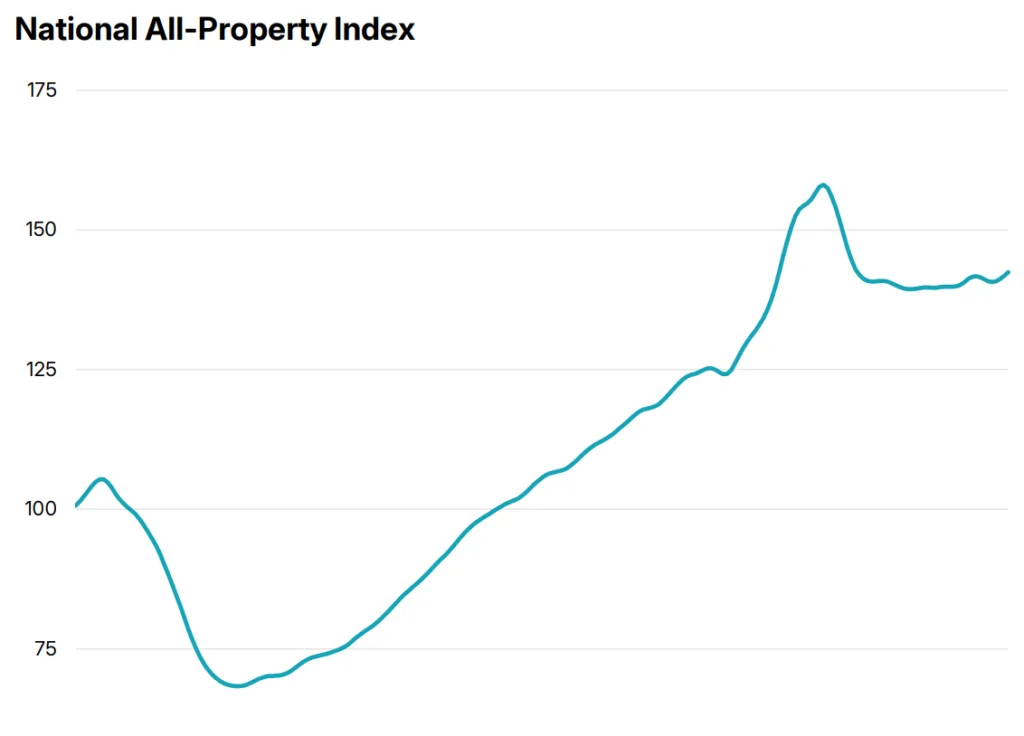
Source: MSCI Inc.
Sector performance also varies widely. Industrial remains the only sector above its July 2022 level, up 10%. Apartment and retail prices remain 20% and 7% below that benchmark. Retail has posted modest gains in recent months despite annual declines. Meanwhile, apartment prices continue falling faster. These differences show how each index captures different market realities. Therefore, investors should compare both indexes before allocating capital or underwriting risk.
What’s Next
CRE leaders should expect an uneven recovery and continued mixed signals. Elevated interest rates will likely keep pressuring pricing and deal activity. The Federal Reserve also signaled more tightening in June. As a result, near-term relief remains unlikely.
Meanwhile, distressed office assets will likely keep selling at steep discounts. Industrial and select leisure assets should continue attracting premium pricing. Therefore, investors should use both RCA CPPI and CCRSI when evaluating opportunities. Expect further index volatility as sector stress and local recoveries continue through 2026. The next reports will show whether national stabilization continues or office and multifamily markets weaken further.