- CRE cap rate spreads over the 10-year Treasury yield narrowed from 393 bps in 2015 to 180 bps in Q1 2025.
- Office assets now have the widest spread at 2.28%, while industrial has the tightest at just 0.33%.
- Tightening spreads reflect stronger investor confidence in sectors like multifamily and industrial.
A Shifting Baseline
According to GlobeSt, for investors, the 10-year Treasury yield sets the standard for risk-free returns. However, the real insight lies in the spread between this rate and other asset yields. These spreads reflect market risk, credit conditions, and investor sentiment.
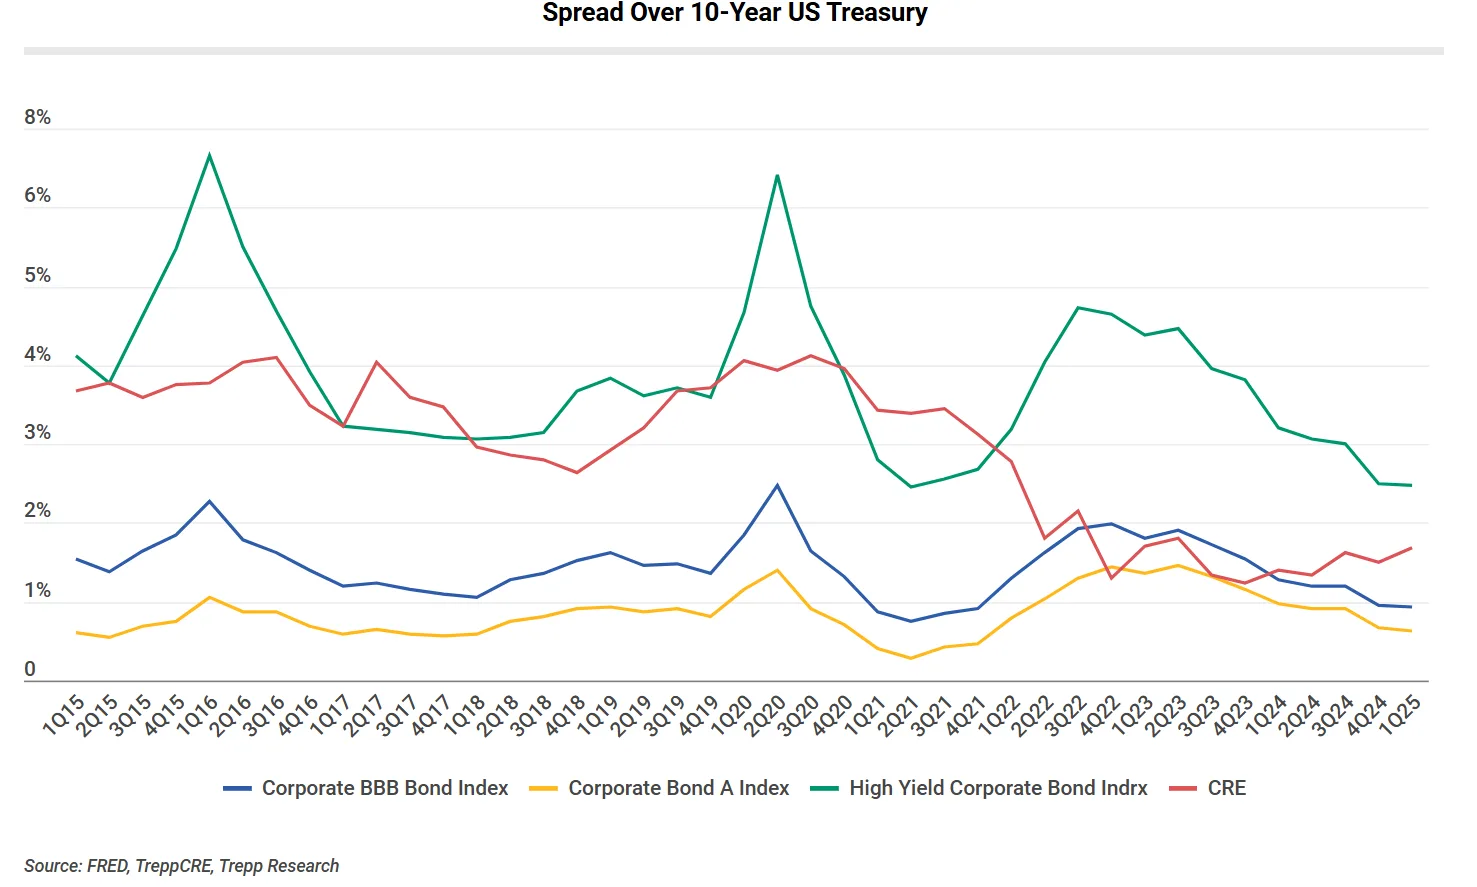
Trepp recently analyzed 10 years of spread data. From 2015 to early 2025, the average spread between the 10-year Treasury and the ICE BofA US Corporate A Bond index was 0.91%. In fact, the spread stayed at or above 100 basis points in 71% of quarters.
Bond Market Comparison
The ICE BofA US Corporate BBB Bond index, which carries more credit risk, had a higher average spread of 155 basis points. It also showed strong correlation—81%—with the A-rated index. In contrast, high-yield corporate bonds showed far greater volatility, with an average spread of 410 basis points. These bonds are more sensitive to changes in credit quality and economic outlook.
CRE Spread Trends
CRE offers a different risk profile. Over the past 10 years, the spread between CRE cap rates and the 10-year Treasury started at 393 basis points and dropped to 180 bps by Q1 2025. During most of this period, CRE spreads stayed between A and BBB bond yields. But starting in Q3 2021, CRE spreads began to shrink. Between Q2 2022 and Q2 2024, CRE followed both benchmarks closely. By Q2 2024, the spread again moved above both indexes.
By Property Type
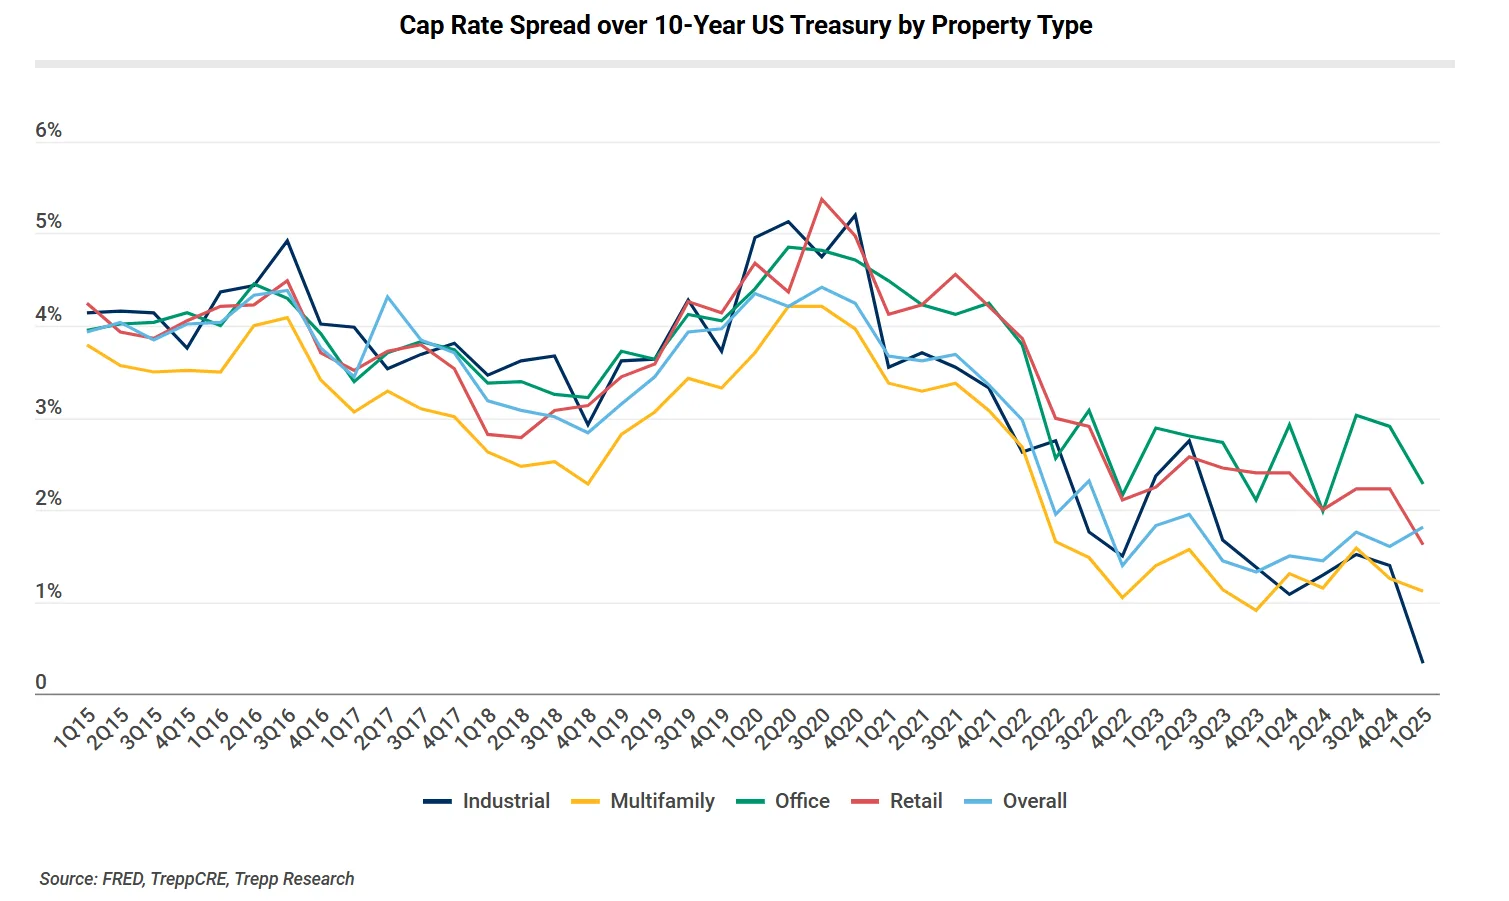
Spreads by sector have moved apart over time. In 2015, most property types had spreads near 4%. Office was at 3.93%, retail at 4.24%, industrial at 4.14%, and multifamily at 3.80%. That grouping stayed consistent until early 2020.
Since then, the gap has widened. By early 2025, office topped the list with a 2.28% spread. Retail followed at 1.62%, then multifamily at 1.11%. Industrial had the smallest spread at only 0.33%. Overall, the average stood at 1.80%.
Why It Matters
Yield spreads tell us more than just numbers. They show investor sentiment and perceived risk. When spreads widen, investors are cautious. When they tighten, confidence returns.
CRE spreads are now much lower than they were a decade ago. This shift suggests investors see more stability in sectors like industrial and multifamily. These assets offer strong fundamentals, inflation protection, and steady income.
Looking Ahead
CRE remains a strong middle ground between investment-grade and high-yield bonds. Its spreads are higher than bonds rated A but lower than high-yield options. This balance offers a blend of income and stability.
Cap rates tend to move slowly, which helps preserve capital in volatile times. But tighter spreads may limit future returns unless rents rise or interest rates fall. Watching these shifts will be key for investors in the second half of 2025.
Bottom Line
Yield spreads help investors measure value and risk across asset classes. For CRE, shrinking spreads point to growing confidence. Still, with policy and economic uncertainty ahead, investors should watch these signals closely.
Get Smarter about what matters in CRE
Stay ahead of trends in commercial real estate with CRE Daily – the free newsletter delivering everything you need to start your day in just 5-minutes


