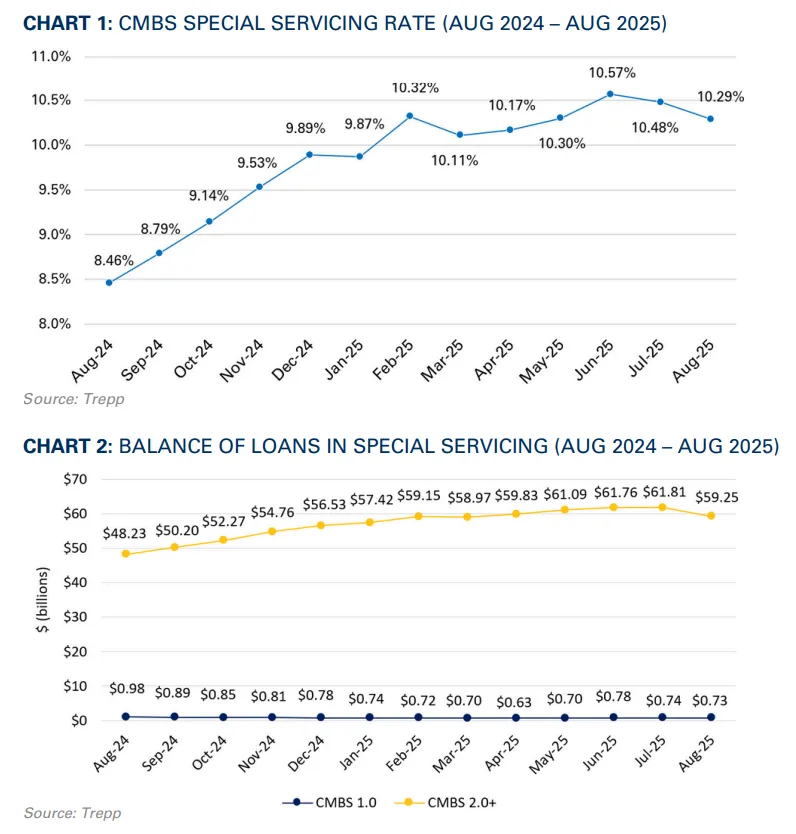


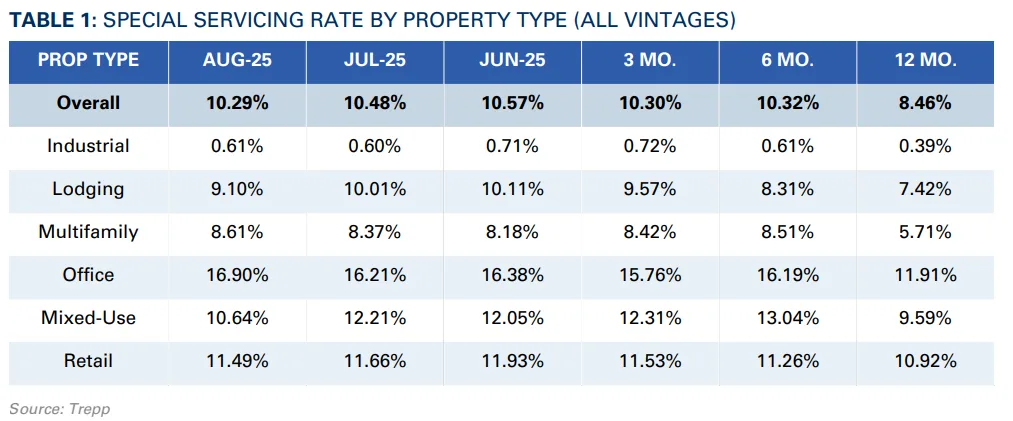
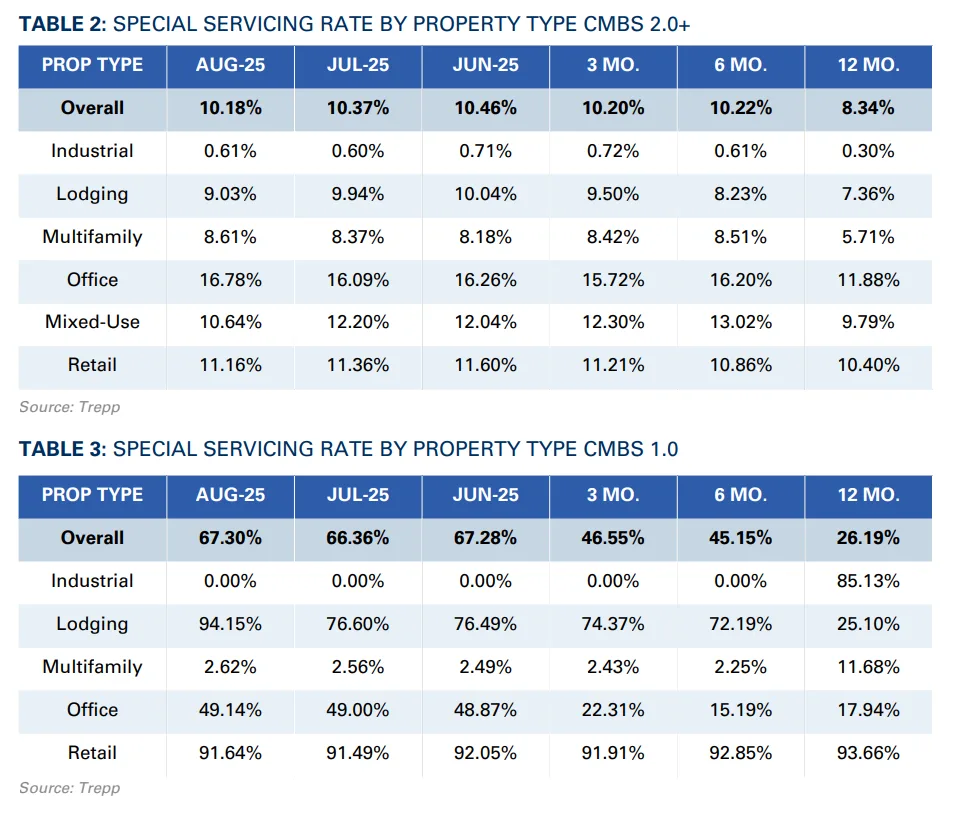
- The overall CMBS special servicing rate fell 19 basis points in August to 10.29%, its second consecutive monthly decline after peaking in June.rn
- Lodging (-91 bps) and mixed-use (-157 bps) drove the improvement, while office surged to a new record high of 16.90% (+70 bps).rn
- New transfers to special servicing nearly doubled from July, reaching $2.4B, led by large retail and office loans.rn
- CMBS 1.0 rates remain heavily distressed at 67.30%, compared to 10.18% for CMBS 2.0+.rnrnrn
Rates Ease for the Second Month
trepp reports that the cmbs special servicing rate receded to 10.29% in August, down 19 basis points from July and marking its second monthly decline since reaching a peak in June. The improvement was driven largely by a reduction in the balance of outstanding loans, which fell nearly $14B to $583B. While this headline number offers some relief, the picture remains uneven across property types.
Lodging posted one of the most significant shifts, falling 91 basis points to 9.10%. The sector has shown steady improvement as hotel performance continues to stabilize. Mixed-use saw an even sharper decline, dropping 157 basis points to 10.64%, a welcome reversal after more than a year of steady increases.
On the other end of the spectrum, the office sector continued its troubling trajectory, rising another 70 basis points to a record 16.90%. Retail and multifamily rates moved little in August, with retail slipping modestly to 11.49% and multifamily holding steady at 8.61%. Industrial remained the healthiest property type by far, steady at just 0.61%.
Transfers Regain Momentum
After a lull in July, when just $1B in loans were newly transferred, August saw activity nearly double to $2.4B. Office and retail dominated, accounting for 90% of the total volume.
The largest new transfer was the $545.8M HBS Portfolio loan, backed by 34 Lord & Taylor and Saks Fifth Avenue stores across more than 4.5M SF. Although the loan moved into special servicing due to imminent monetary default, the borrower has already secured a refinancing term sheet sufficient to pay off the balance.
The second-largest transfer was the $463M loan on 5 Bryant Park, a nearly 685,000 SF office property in Manhattan. The loan transferred for balloon maturity default, and the special servicer has instituted cash management and a tax escrow while discussions with the borrower over refinancing continue.
Get Smarter about what matters in CRE
Stay ahead of trends in commercial real estate with CRE Daily – the free newsletter delivering everything you need to start your day in just 5-minutes
CMBS 1.0 vs. 2.0+: A Tale of Two Markets
The gulf between legacy CMBS and post-crisis transactions remains stark. The CMBS 1.0 special servicing rate climbed to 67.30% in August, compared with just 26.19% one year ago.
In contrast, CMBS 2.0+ deals remain far more stable, with the rate slipping to 10.18% from 10.37% in July. The difference reflects the structural reforms and stronger underwriting standards introduced after the financial crisis, which continue to cushion newer deals against the severity of distress seen in older vintages.
Outlook
August’s numbers provide a measure of optimism, particularly in lodging and mixed-use, where sustained improvements may be underway. Yet the persistent climb in office distress underscores the headwinds facing that sector, with large, high-profile properties like 5 Bryant Park joining the watchlist. With billions in office and retail loans transferring in August alone, special servicing volumes are likely to remain elevated in the coming months.