


- The US CMBS special servicing rate rose slightly to 10.86% in November, a 12-year high, despite a drop in loan balances due to maturities and payoffs.
- Only the industrial sector saw an increase in its special servicing rate, rising to 0.74%, while lodging, multifamily, office, and mixed-use all declined; retail remained unchanged.
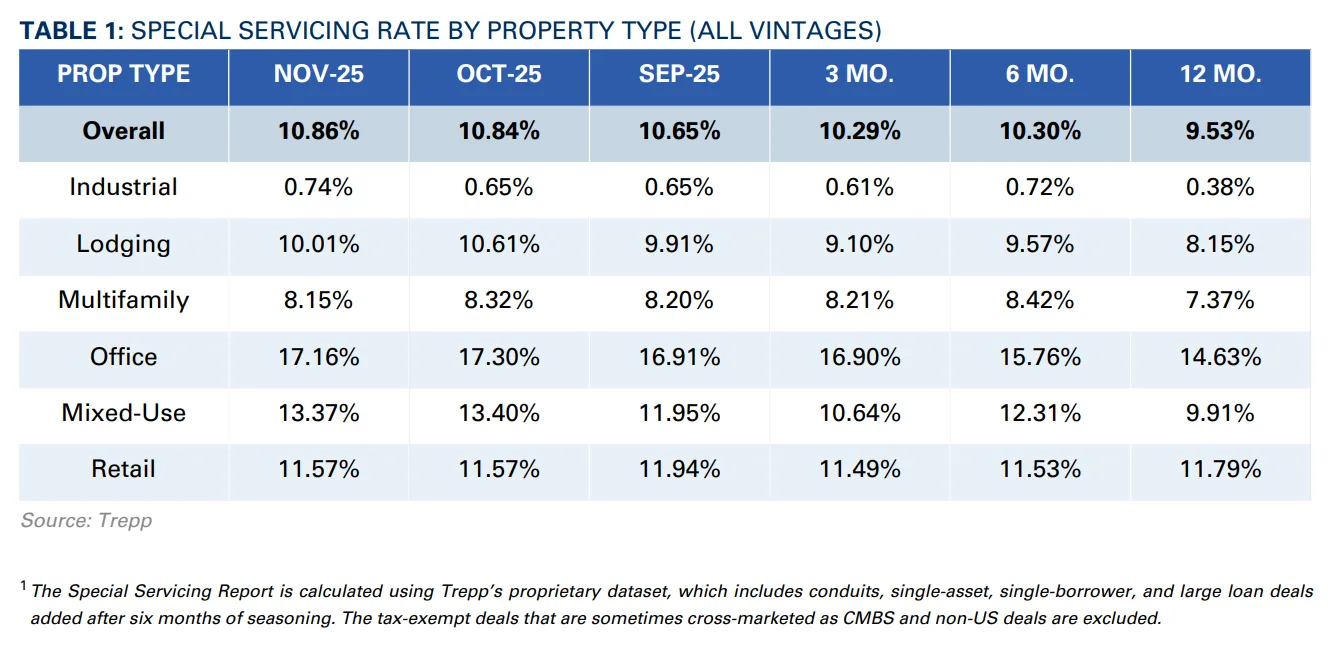
- Office loans still have the highest rate at 17.16%, followed by retail at 11.57%, and mixed-use at 13.37%.
- New transfers to special servicing totaled $2.3B, down from October. Notably, office properties made up 43% of that figure.
Another Record Month
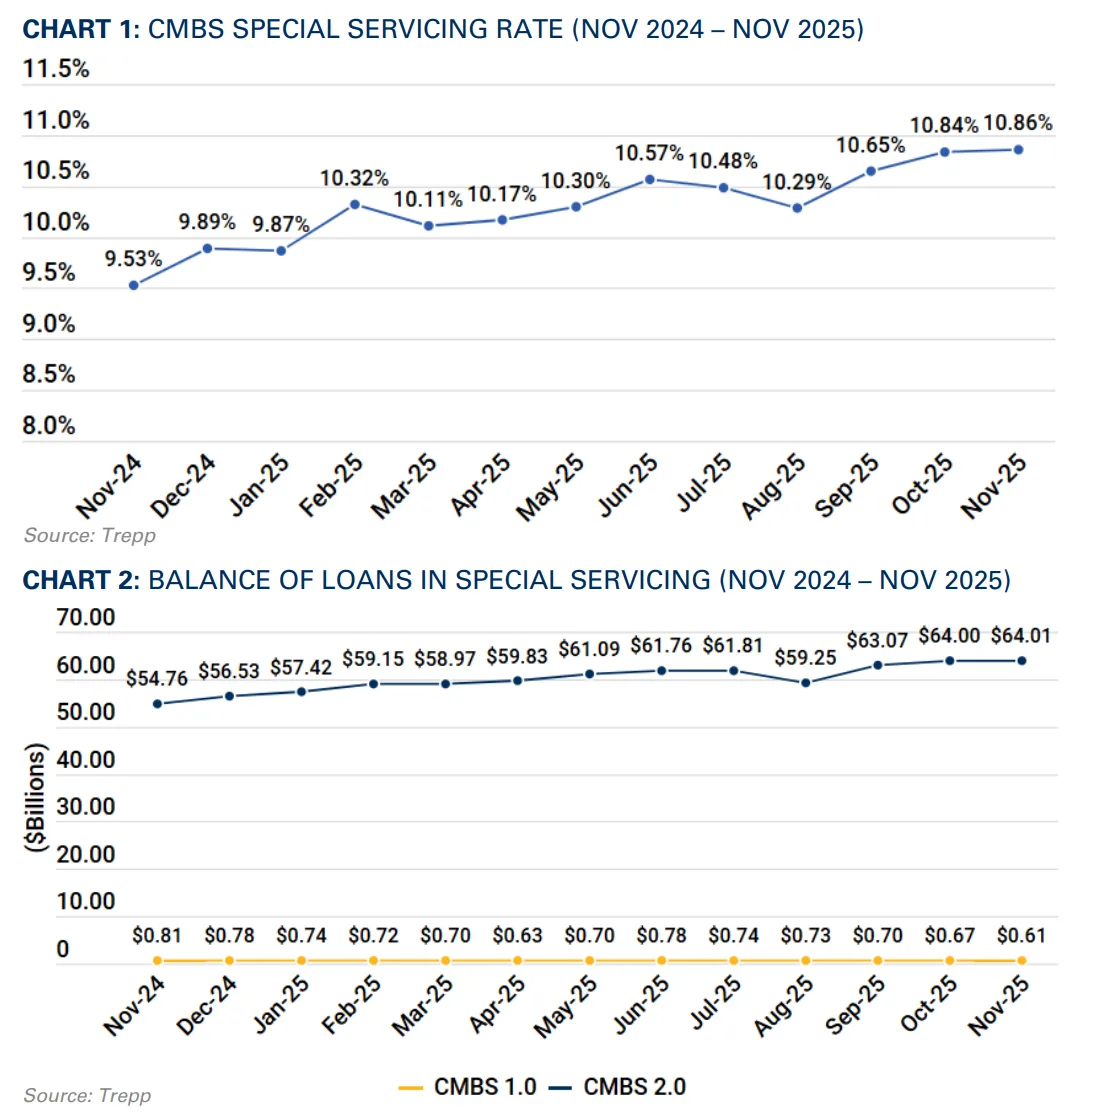
The US CMBS special servicing rate rose for the third straight month in November, edging up by two basis points to 10.86%. This is the highest rate since 2013, according to Trepp’s latest data.
The paradox? Even as the rate increased, the dollar balance of loans in special servicing fell by $45M to $64.6B. The rate increase was driven by a shrinking CMBS loan universe, which dropped by $1.7B in the month due to loan maturities and paydowns.
Sector Breakdown
Only one major property type—industrial—saw an increase in special servicing activity, rising from 0.65% in October to 0.74% in November.
On the other hand:
- Lodging dropped 60 bps to 10.01%, the sharpest decline.
- Multifamily fell 17 bps to 8.15%.
- Office dipped slightly to 17.16%, down from last month’s all-time high of 17.30%.
- Mixed-use dropped 3 bps to 13.37%.
- Retail was flat at 11.57%.
Some property types, like multifamily and lodging, have shown moderate improvements recently, reflecting the temporary easing seen earlier in the year before the latest uptick.
New Special Servicing Transfers
The volume of newly transferred loans fell by $246M month-over-month, totaling $2.3B in November. However, the composition shifted heavily toward office and retail loans:
- Office: $1B across 9 loans (43% of the total)
- Retail: $775M across 4 loans (34%)
- Lodging: 8%
- Multifamily: 3%
- Industrial: 2%
- Mixed-use: just 6%, down significantly from October’s 40%
The two largest transfers:
- New York Times Building Loan ($515M): Transferred ahead of maturity despite being current. Underwritten in 2018, extended five times, now uncertain at final maturity.
- Starwood Regional Mall Portfolio ($488.7M): Transferred due to an imminent default. The top asset is reportedly under contract, but the portfolio has faced multiple delinquencies in the past.
Get Smarter about what matters in CRE
Stay ahead of trends in commercial real estate with CRE Daily – the free newsletter delivering everything you need to start your day in just 5-minutes
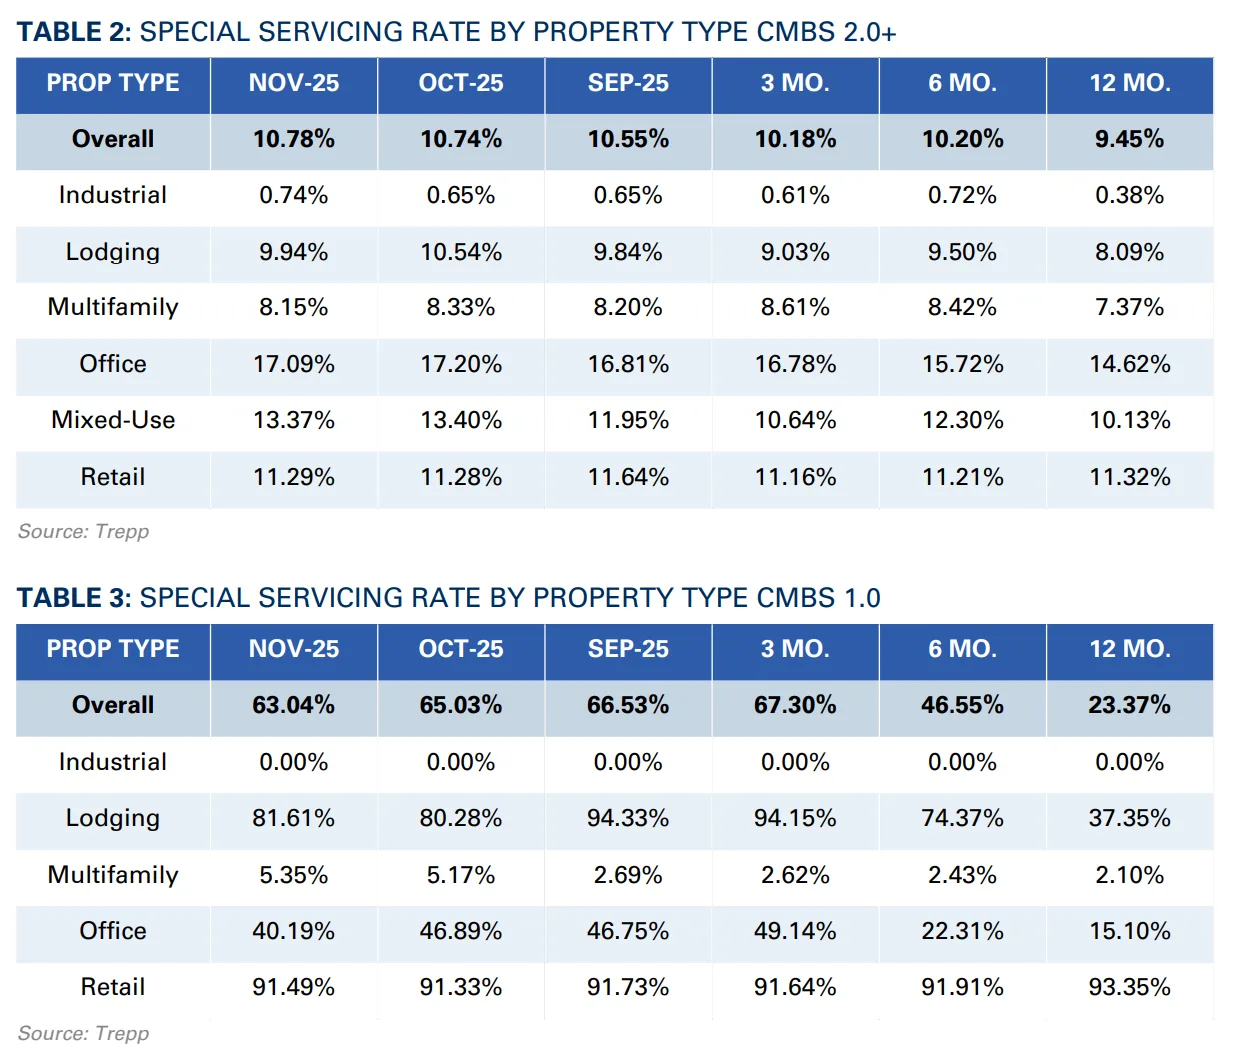
By Vintage: CMBS 1.0 vs. CMBS 2.0+
The CMBS 2.0+ rate rose to 10.78%, up from 10.74% in October and 9.45% a year ago.
In contrast, CMBS 1.0 surged to 63.04%, nearly triple the rate from a year ago (23.37%), underscoring legacy challenges in pre-2008 vintages.
Why It Matters
Special servicing rates are a critical early signal of distress in the CMBS market. The continued uptick—particularly with office loans—highlights the lasting impact of remote work, maturing debt, and shifting demand across asset types.
Though multifamily and lodging saw improvement this month, the sectoral imbalance and aging portfolios in CMBS 1.0 could weigh on recovery into 2026.
What’s Next
With loan maturities looming and refinancing conditions tightening, distress levels in the CMBS space could remain elevated well into 2026. Market participants should expect continued scrutiny of office and retail portfolios, where defaults and extensions are becoming more common.
Trepp’s data shows that bracing for volatility across older vintage loans and maturing large balances may be the new norm.