


- Self storage rents declined nationally with a -2.0% annual rate drop in March 2026.
- All top 30 metros reported negative year-over-year rent growth for main unit sizes.
- Development pipeline remains active, with 2.3% of inventory under construction and no slowdown in major markets.
- Sector consolidation continues, highlighted by Public Storage’s $10.7B acquisition of National Storage Affiliates.
Market Overview
The US self storage sector entered 2026 with declining rents and persistent supply pressure. According to Yardi Matrix’s April Self Storage National Report, advertised rates fell 2.0% year-over-year in March, deepening from a -1.2% drop in February. The average national street rate was $16.07 PSF, with nearly every major metro posting negative growth for both climate-controlled and non-climate-controlled units.
Market performance remains muted due to a weak housing sector and sustained development activity, especially in Sun Belt metros struggling to absorb new supply. Despite diminished operating momentum, the industry saw a notable deal: Public Storage’s $10.7B purchase of National Storage Affiliates, expanding its portfolio and raising sector concentration.
Rent Performance Dips Further
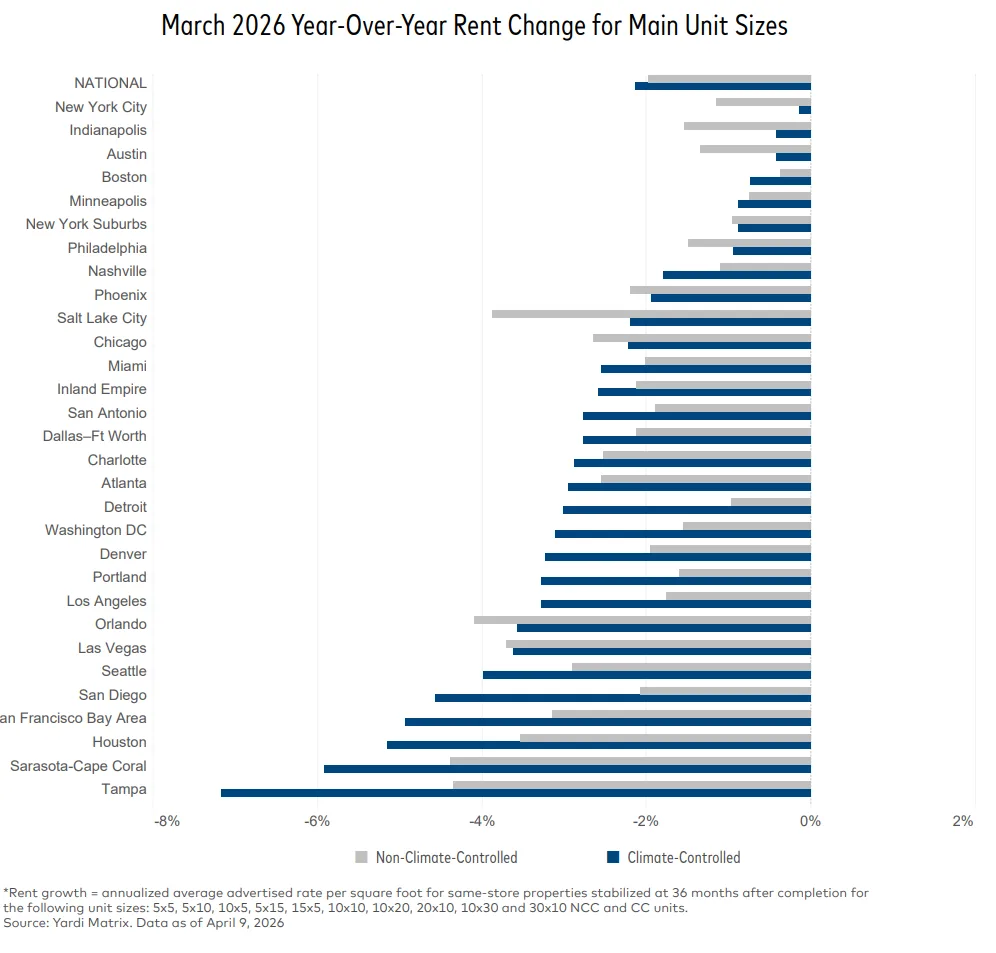
Rent declines accelerated for both climate-controlled (CC) and non-climate-controlled (NCC) units in March. NCC rates dropped 2.0% year-over-year, slightly outperforming CC, which fell 2.1%. All top 30 US metros tracked by Yardi Matrix experienced negative annual rent growth. Self storage REITs were also impacted, with annual rent declines for advertised rents widening to -4.0% from -2.2% in February.
Supply and Pipeline Dynamics
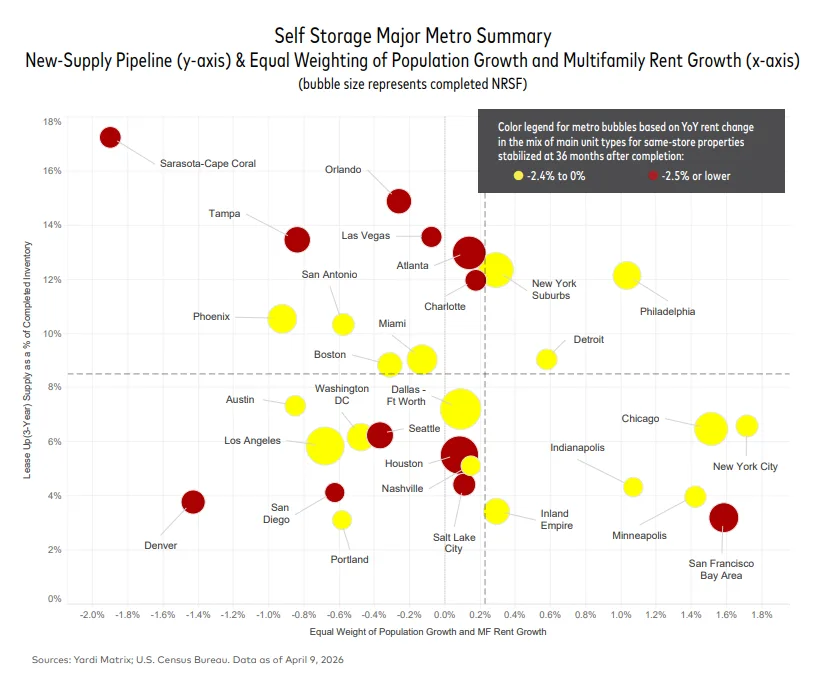
The self storage trends report highlights a steady development pipeline: 2,619 properties are in some stage of development, with 2.3% of national existing stock under construction at March-end. Eleven of the top 30 metros have more supply underway than a year ago, and almost all metros have expanded their planning pipelines.
Sun Belt markets remain most affected, with metros like Sarasota–Cape Coral leading on new deliveries and ongoing construction relative to inventory, a pattern that continues to weigh on pricing as rates fall while supply keeps expanding across major markets. Conversely, New York City and its suburbs reflect lower new supply and comparatively resilient rents, limiting declines despite overall softness.
Market-Level Details
Month-over-month, national average street rates inched up 0.1% from February to March, but this gain lagged normal seasonal trends. Just 13 of the top 30 metros saw increases. Tampa performed worst among major markets, with a -0.7% monthly drop linked to a wave of new completions and aggressive discounting by operators.
March’s year-over-year rent declines ranged from -0.5% in New York City to -5.9% in Tampa for main unit types, reflecting broad-based softness. Nationally, 9.3% of inventory has been delivered in the past three years, and new supply in the last 12 months accounted for 2.4% of starting stock. The development focus remains tilted toward large markets, adding more near-term pressure on rents.
What’s Next
Self storage trends point to continued rate softness in 2026, as sustained construction activity and weak demand limit pricing power. While robust investment and consolidation highlight long-term confidence in the sector, operational recovery will likely depend on a rebound in housing activity or a slowdown in the development pipeline.
Get Smarter about what matters in CRE
Stay ahead of trends in commercial real estate with CRE Daily – the free newsletter delivering everything you need to start your day in just 5-minutes