


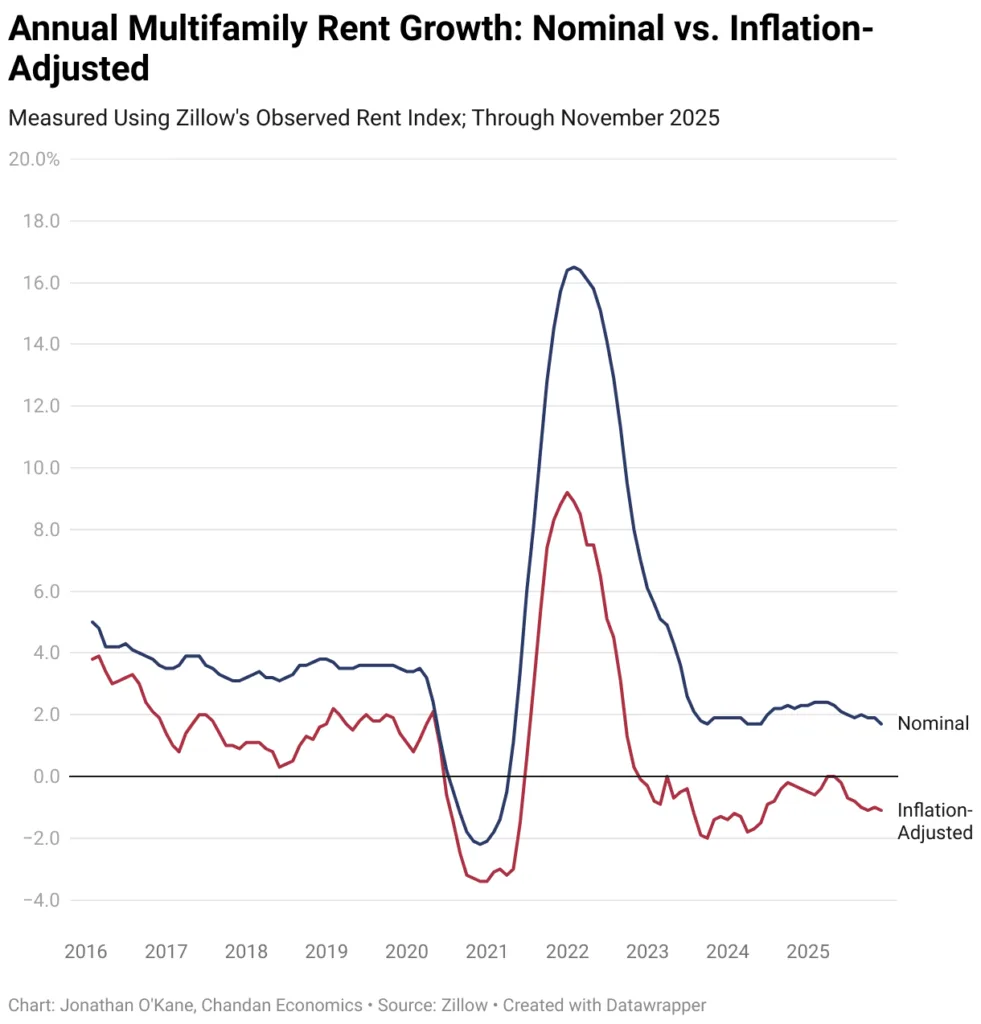
- National multifamily rents rose 1.7% year-over-year in November, but inflation-adjusted rents fell 1.1%, marking 37 consecutive months of real rent decline.
- Rent growth was strongest in Northeast and Midwest metros like Syracuse, Rochester, and Chicago, while several Sun Belt markets—particularly Cape Coral and Austin—saw steep annual declines.
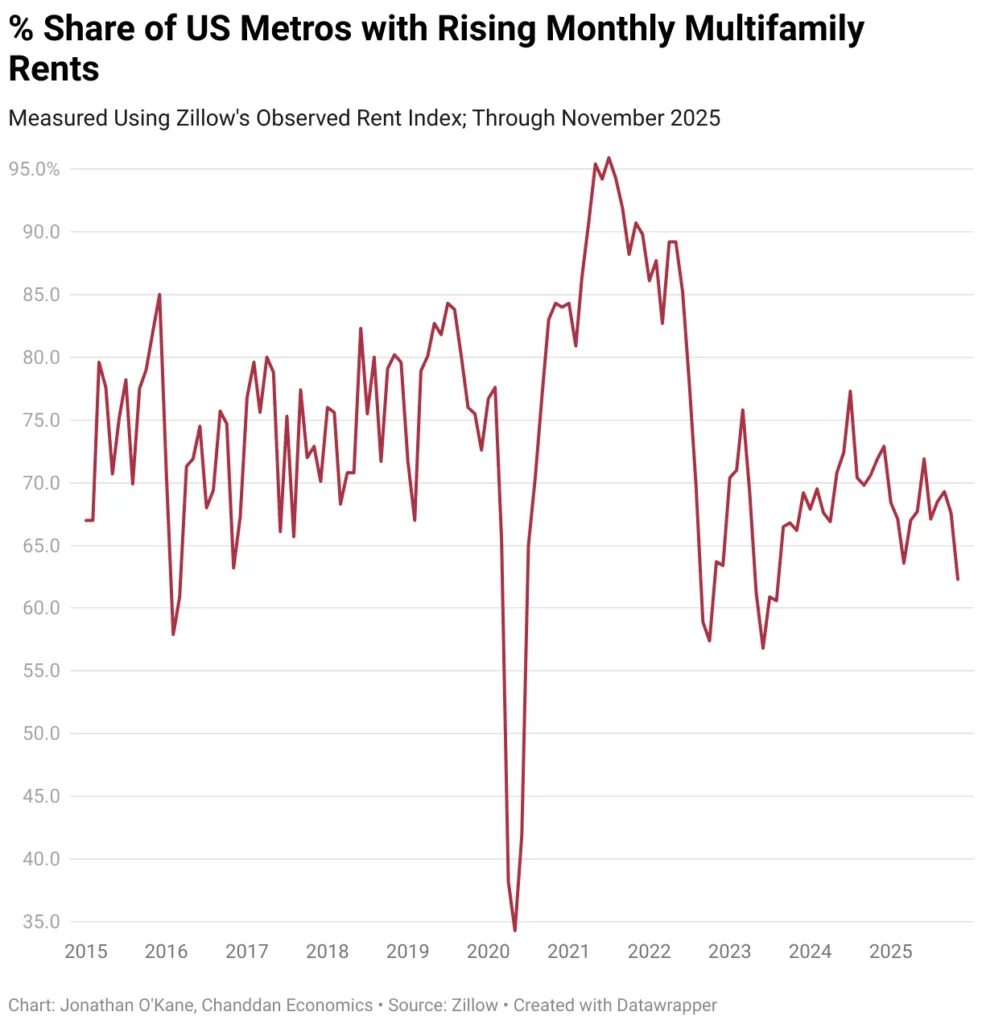
- Just 62.3% of metros posted monthly rent gains in November, down from prior months, highlighting a narrowing scope of rent increases across the country.
Nominal Gains, Real Losses
Multifamily rent growth in the US remained positive in name only last month, reports Chandan. According to the Zillow Observed Rent Index (ZORI), national rents rose 1.7% year-over-year in November 2025. However, with inflation outpacing nominal gains, real rents fell 1.1%, marking the 37th consecutive month of inflation-adjusted rent contraction.
Month-over-month, rent growth continued to decelerate. Only 62.3% of metro areas posted increases, down from October. This figure is also well below the widespread gains seen during the pandemic housing boom of 2021–2022.
Northeast And Midwest Lead
Several Midwest and Northeast cities outperformed in November, continuing a trend of stronger rent growth in supply-constrained metros.
Top 5 Markets for Annual Rent Growth:
- Syracuse, NY – +5.91%
- Rochester, NY – +5.65%
- San Francisco, CA – +5.58%
- Chicago, IL – +5.56%
- Providence, RI – +5.51%
Conversely, markets in the Sun Belt and Mountain West continued to see declining rents, weighed down by new supply and softening demand.
Bottom 5 Markets for Annual Rent Growth:
- Cape Coral, FL – −6.75%
- Austin, TX – −4.43%
- Colorado Springs, CO – −3.93%
- North Port, FL – −3.46%
- Phoenix, AZ – −1.75%
Get Smarter about what matters in CRE
Stay ahead of trends in commercial real estate with CRE Daily – the free newsletter delivering everything you need to start your day in just 5-minutes
Month-Over-Month Trends
The monthly data painted a more mixed picture, with several smaller or coastal metros notching incremental gains, while rent declines persisted in oversupplied markets.
Top 5 Monthly Gainers:
- Urban Honolulu, HI – +0.83%
- Virginia Beach, VA – +0.68%
- Hartford, CT – +0.67%
- Providence, RI – +0.61%
- Syracuse, NY – +0.57%
Top 5 Monthly Decliners:
- Knoxville, TN – −1.02%
- Cape Coral, FL – −0.96%
- Tampa, FL – −0.78%
- Colorado Springs, CO – −0.77%
- Winston-Salem, NC – −0.70%
Why It Matters
The November rent data highlight a market in transition. Despite easing from pandemic highs, uneven demand and new supply in fast-growing metros continue to pressure rent performance.
For developers and investors, the gap between nominal and real rent growth is a critical signal. Though pricing appears stable, inflation-adjusted returns are down, affecting underwriting, rent projections, and long-term asset values.
What’s Next
Expect continued softness in markets with heavy new supply pipelines, especially across the Sun Belt. Meanwhile, low-vacancy urban cores in the Northeast and Midwest may continue to see modest gains. But until inflation subsides or wage growth outpaces cost-of-living increases, real rent growth may remain elusive into early 2026.