


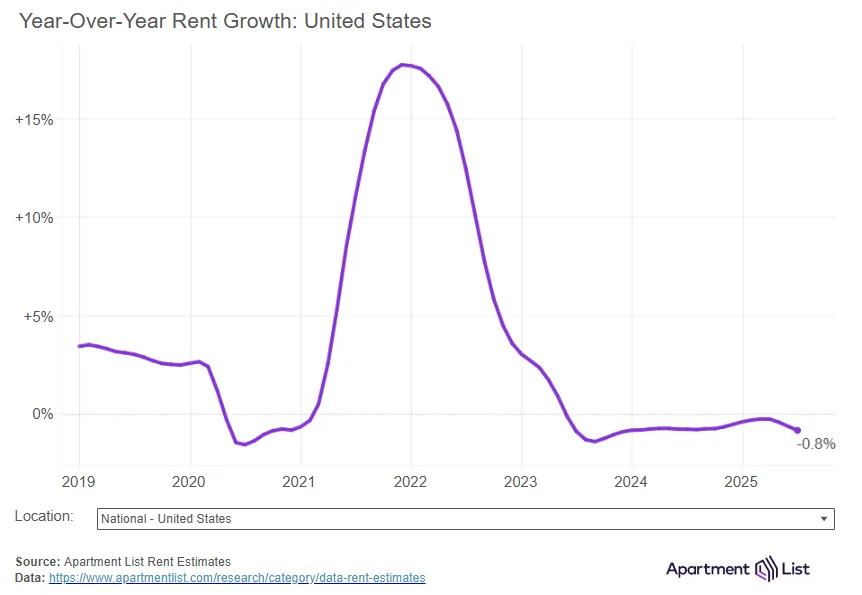
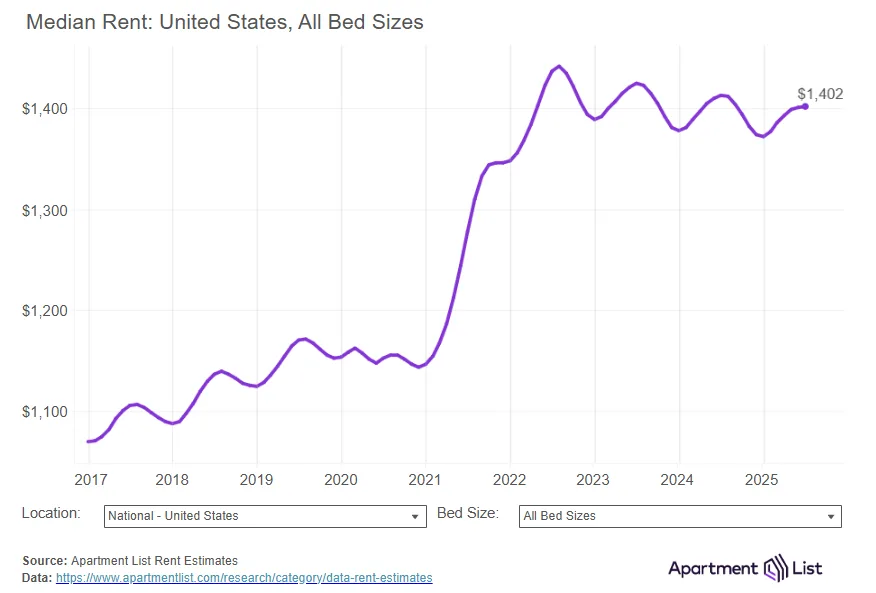
- The national median rent was unchanged in July and is now down 0.8% year-over-year, reflecting a sluggish market during what is typically peak leasing season.
- The national multifamily vacancy rate rose to 7.1%, a new record for Apartment List’s index, driven by an unprecedented construction boom.
- Austin leads the nation in rent declines, down 6.8% annually, while San Francisco tops the chart for growth, up 4.6% year-over-year.
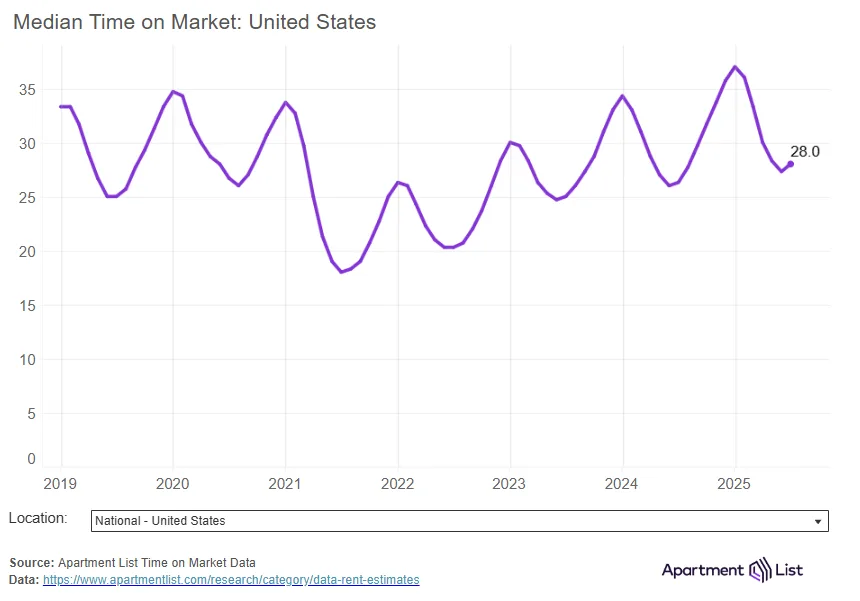
- Units are taking longer to lease again, with average list-to-lease time ticking up to 28 days, indicating continued softness in demand.
National Rents Stall Despite Moving Season
Rents were flat in July, marking the fourth straight month of slowing growth during what is typically the busiest leasing season of the year. The national median rent remains at $1,402, down 0.8% compared to the same time last year. This reverses the modest gains seen earlier in the spring and signals a broader cooling of the market, reports Apartment List.
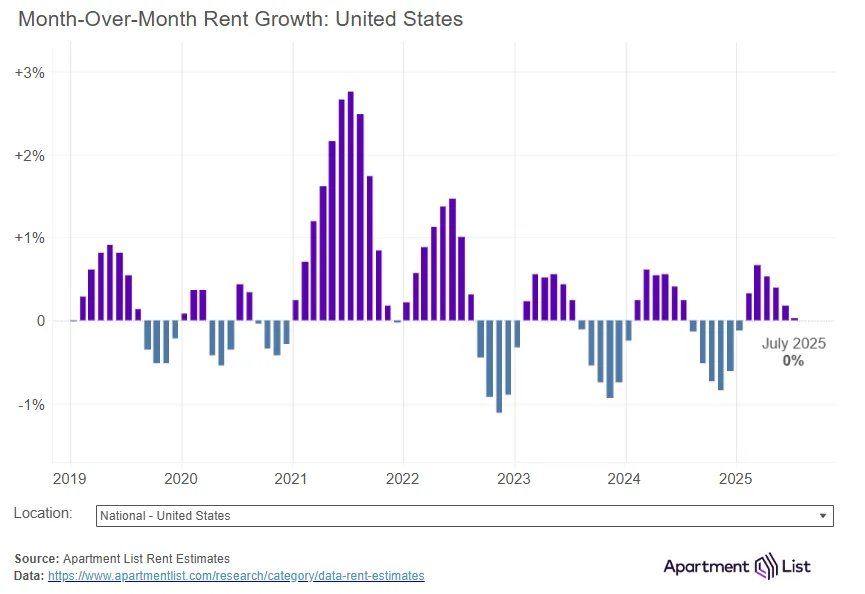
Year-over-year rent growth had inched toward positive territory earlier in 2024 but has now turned negative for three consecutive months. The July figure returns the market to the same -0.8% annual decline seen last fall.
Vacancy Rate Hits All-Time High
Vacancy continues to climb as the market absorbs a historic wave of new multifamily construction. The national vacancy rate rose to 7.1% in July—an all-time high since Apartment List began tracking this data in 2017.
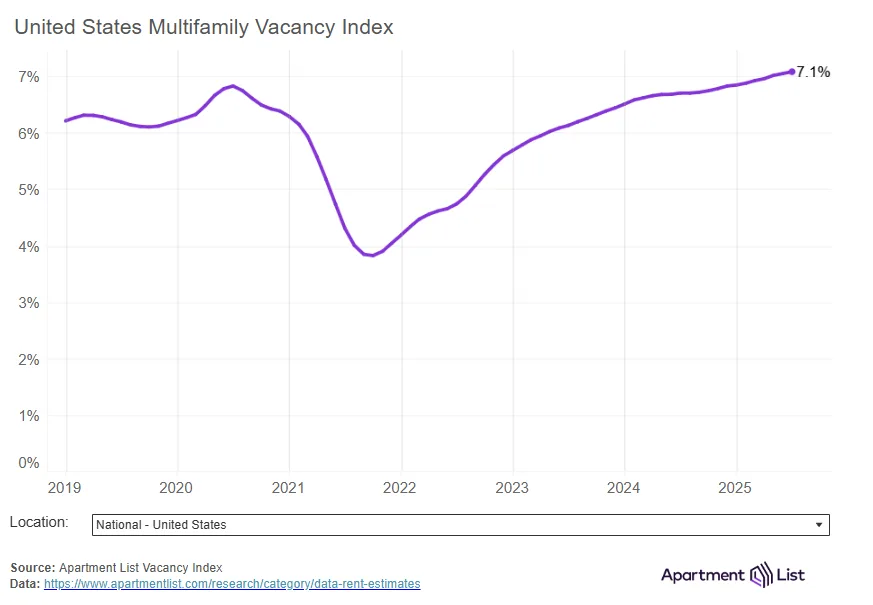
Over 600K new units were delivered in 2024, the highest annual total since the 1980s. While construction is expected to slow in the second half of the year, vacancy remains elevated, with more inventory than demand in many markets.
Leasing Times Lengthen Again
The time it takes to lease a unit rose for the first time this year, with average “list-to-lease” time increasing to 28 days in July, up from 27 days in June. Although improved from the January high of 37 days, units are still sitting on the market longer than during prior peak seasons. Compared to July 2021, when demand was strongest, properties now take 10 days longer to lease.
Regional Trends
Regional performance continues to diverge. The Sun Belt is experiencing the sharpest rent declines due to rapid permitting and oversupply. Austin leads with a 6.8% year-over-year drop and an 18% decline from its 2022 peak. Other markets with similar trends include Denver, Phoenix, San Antonio, and Raleigh.
Conversely, the Bay Area is rebounding. San Francisco rents are up 4.6% year-over-year, with the city itself seeing a 10.6% surge. Rents there are just now returning to pre-pandemic levels. Other strong performers include Midwest cities like Chicago and Minneapolis, as well as Northeastern markets such as Providence and Hartford.
Why It Matters
The softening rent environment underscores the impact of recent supply surges and shifting demand. While affordability pressures had dominated the conversation in recent years, a wave of new inventory is providing some relief—at least temporarily. Still, developers and owners face growing challenges in pricing and leasing.
What’s Next
The multifamily market may begin to tighten again as construction slows in late 2025 and into 2026. However, economic uncertainty—driven in part by macroeconomic policies like tariffs—continues to dampen renter confidence. For now, the oversupplied market appears poised for continued softness into the fall.