


- The global professionally managed real estate investment market declined by 4.1% in 2024, reducing total market value to $12.5 trillion, down from $13.0 trillion in 2023.
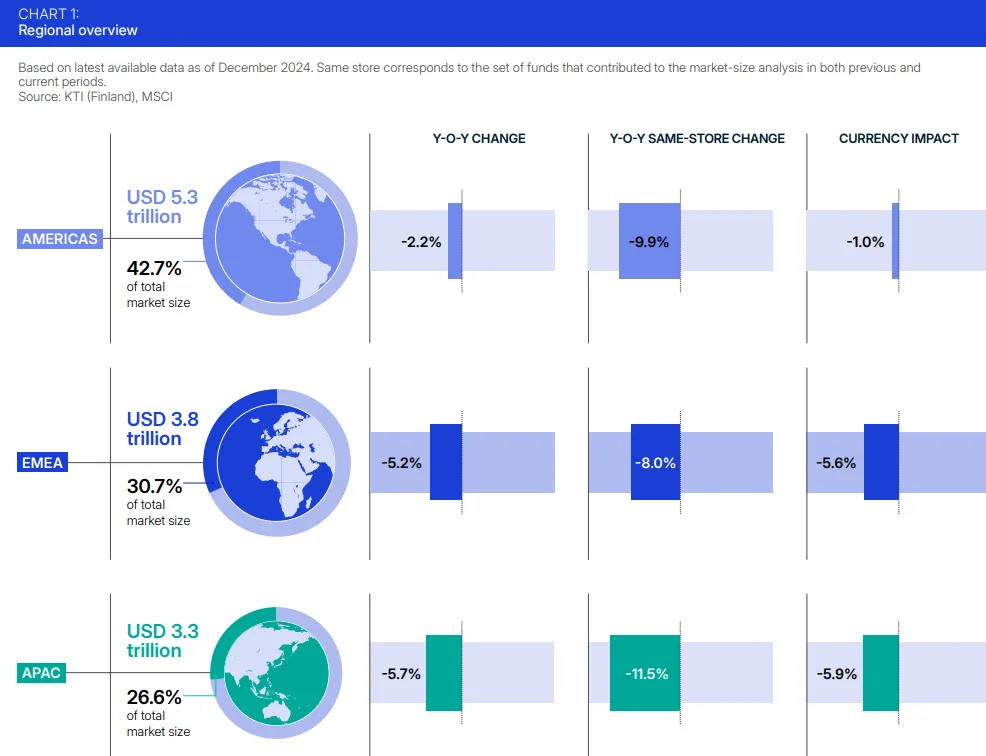
- Currency depreciation against the US dollar was the largest factor behind the contraction, particularly in EMEA and APAC markets.
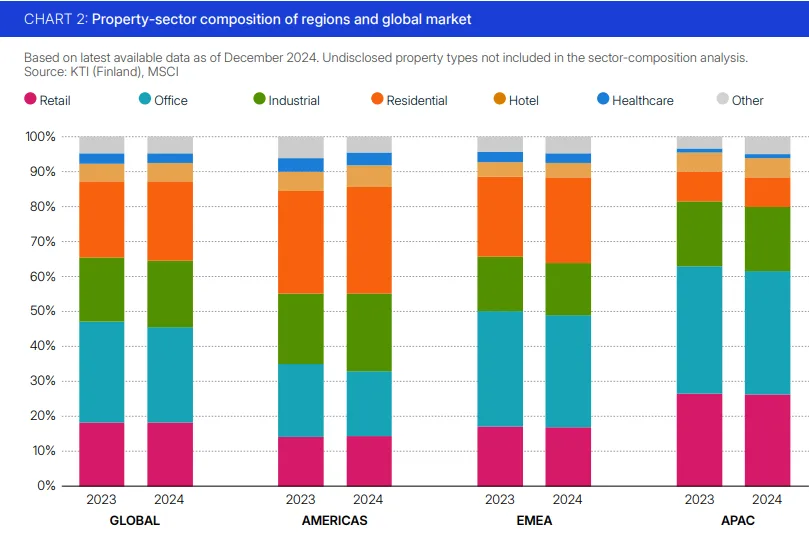
- Office sector’s global share dropped from 28.9% to 27.2%, while industrial real estate overtook office as the second-largest sector in the Americas.
- The US remained the largest single market, valued at $4.9 trillion, representing 39.1% of the global market, up from 38% in 2023.
A Market Reset in Progress
After a decade of growth, 2024 marked the third consecutive year of contraction for the global commercial real estate market. MSCI’s July 2025 report attributes the $500B drop primarily to currency devaluation and a mismatch in buyer-seller expectations, despite a late-year rebound in deal volume.
Transaction activity rose by 18%, buoyed by stabilized interest rates, but was not enough to reverse valuation declines.

Sector Shift: Industrial Gains, Offices Lose Ground
Globally, office retained the largest sector share but shrank by 1.6 percentage points year-over-year. It now makes up 27.2% of the global market. Meanwhile, residential rose to 22.7%, and industrial climbed to 18.9%, surpassing office in the Americas for the first time.
- In the Americas, residential dominates (29.0% share), led by US multifamily housing.
- In EMEA and APAC, office remains dominant, accounting for over 30% of the professionally managed market.
Market Distribution and Rankings
The Americas now represent 42.7% of the global market, followed by EMEA (30.7%) and APAC (26.6%).
Top 5 markets:
- United States – $4.9T
- China – $962B
- United Kingdom – $891B
- Japan – $783B
- Germany – $675B
Among the 38 markets analyzed:
- 31 shrank, including major economies like Germany, Japan, and Canada.
- 6 grew, including Singapore, Poland, and Thailand.
- The US gained 113 basis points in global market share despite a slight nominal decline.
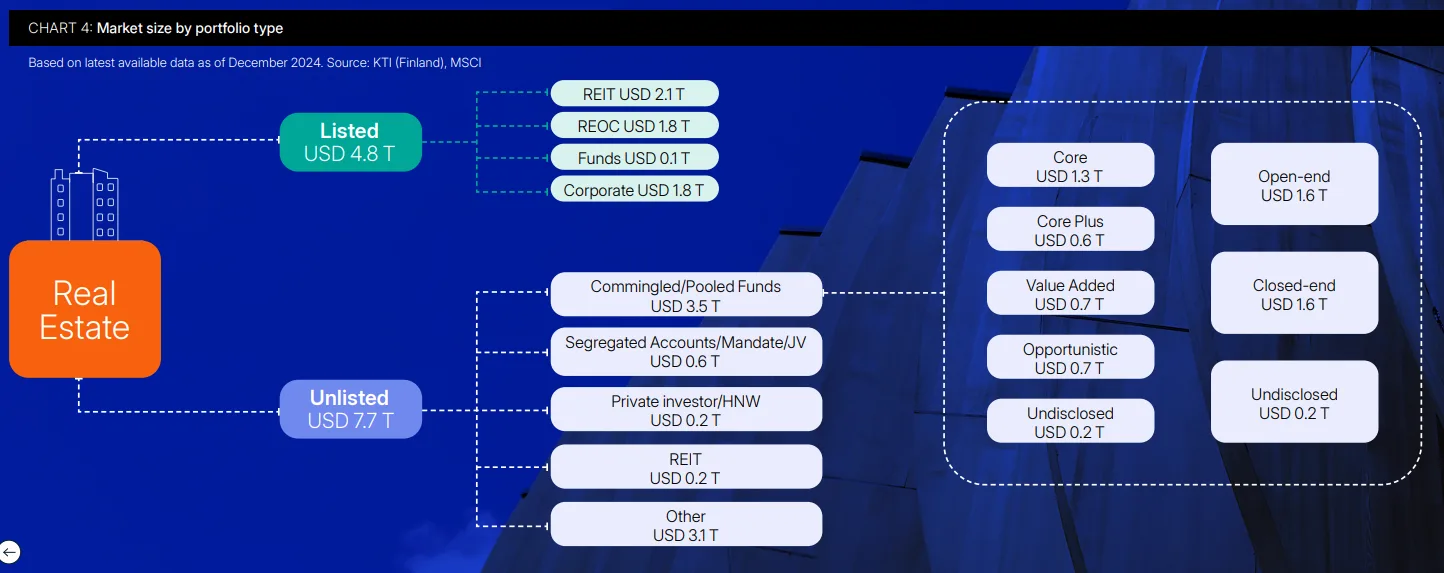
Listed vs. Unlisted Market Composition
MSCI’s breakdown reveals:
- Unlisted real estate accounts for $7.7 trillion (61.4%)
- Listed real estate, including REITs and REOCs, represents $4.8 trillion
Commingled real estate funds made up nearly $3.5 trillion, with:
- Core strategies dominant at 37.0%
- Nearly equal splits between open-ended (46.7%) and closed-ended (46.6%) structures
A Transparency and Liquidity Challenge
The report also correlates market size with transparency, using JLL’s Global Real Estate Transparency Index. More transparent markets like the US, U.K., and Singapore tend to have larger market shares.
Turnover ratios — a proxy for liquidity — rose to 6.2% globally, up from 4.0% in 2023. Malaysia (12.8%), South Korea (11.3%), and Spain (10.1%) posted the highest turnover ratios.
Why it Matters
The report offers a sobering view of how macroeconomic pressures, currency volatility, and evolving asset class preferences are reshaping global real estate. For institutional investors, this data supports portfolio allocation strategies, cross-border investment decisions, and risk modeling.
What’s Next
The inclusion of India, growing investor interest in industrial and residential sectors, and the resilience of listed markets suggest that while the global real estate market is contracting, its composition and regional dynamics are shifting rapidly.
According to MSCI, ongoing data transparency and refined sector analysis will be critical for navigating an increasingly complex global property landscape.
Get Smarter about what matters in CRE
Stay ahead of trends in commercial real estate with CRE Daily – the free newsletter delivering everything you need to start your day in just 5-minutes