


- Office values increased 6.1% in 2025, reaching an average of $182 PSF nationally.
- Vacancy rates decreased to 18.2%, but tech-heavy metros like Seattle still face high levels.
- Office construction starts rose 18.5% year-over-year, but the overall pipeline remains subdued.
- Manhattan office transactions saw prices jump 21.5%, leading major markets.
Office Sector Turns Corner
After several years of falling values, the US office sector saw its first national sales price increase since 2021, according to Yardi Matrix’s February 2026 report. The average office sales price climbed 6.1% to $182 PSF, up from $172 the previous year, signaling a tentative recovery. While values are still down 32.7% from their 2019 peak, several metros, including Miami and Dallas, have surpassed pre-pandemic levels.
Recovery Uneven Across Grades and Locations
Premium (A/A+) rated office buildings posted a 7.5% price gain in 2025, with B-rated properties up 6.2%. Central business districts (CBDs) saw a strong 13.0% increase after previous declines. Suburban office values also rebounded, rising 15.5%. In contrast, urban properties outside the CBD continued to lose value, dropping 16.5%, but still command higher prices than suburban or CBD properties. The divergence highlights an ongoing repricing of location risk in office assets.
Discounted Sales Persist Despite Uptick
The share of office properties selling at a discount dipped slightly to 44.9% in 2025, though the number of discounted transactions increased as total deal activity rose. Notably, a suburban Chicago property sold at a 96% discount from its 2012 price. As underperforming assets trade at steep discounts and stronger properties achieve modest premiums, the office recovery is separating winners and losers, a dynamic also playing out in Manhattan, where even high-profile midtown assets have changed hands at meaningful discounts as part of the broader market reset.
Get Smarter about what matters in CRE
Stay ahead of trends in commercial real estate with CRE Daily – the free newsletter delivering everything you need to start your day in just 5-minutes
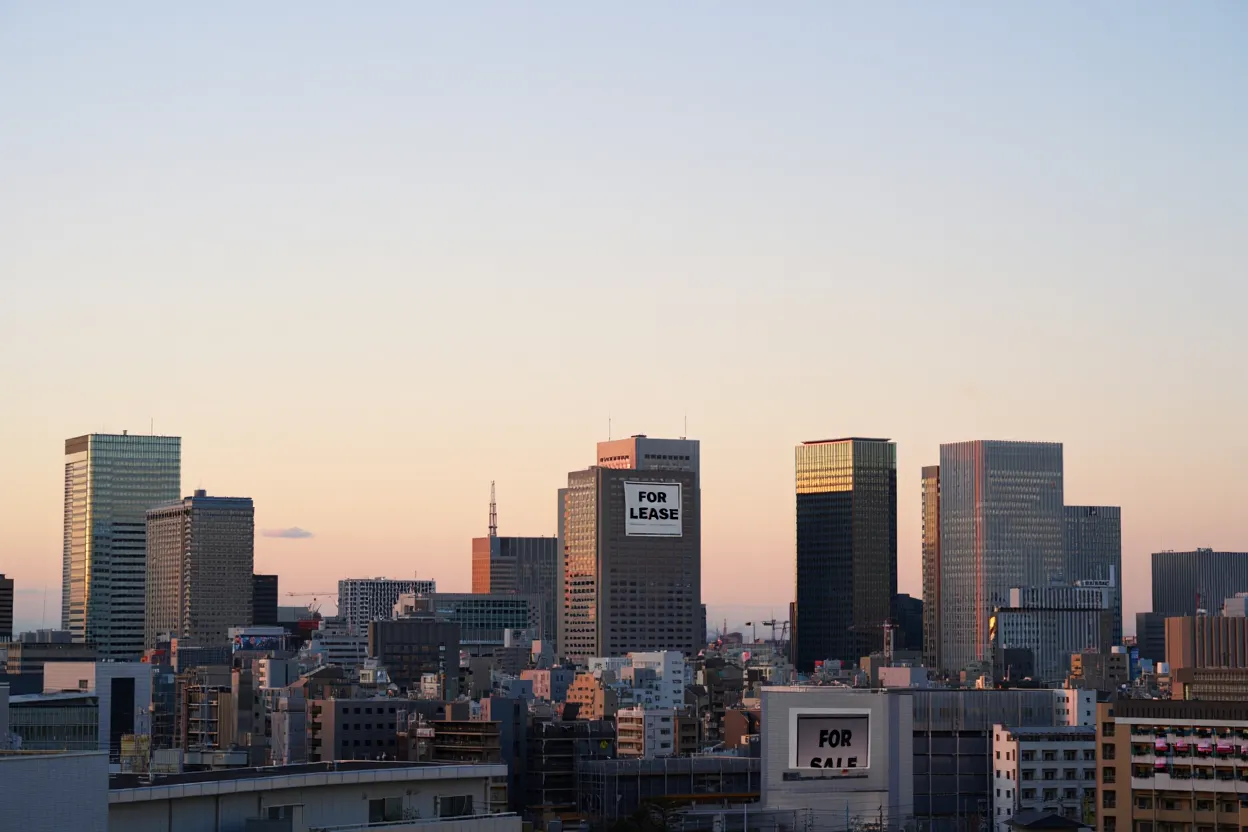
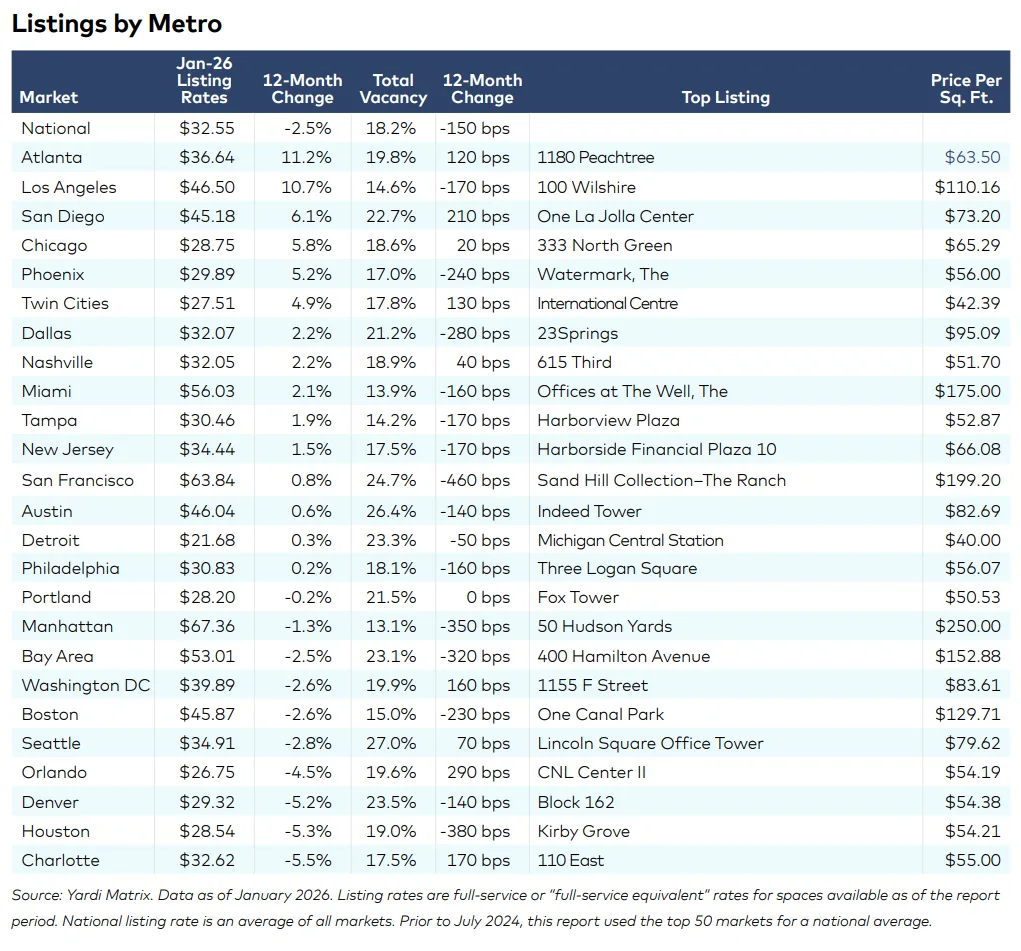
Vacancy and Listing Rates Shift
The national average listing rate slipped to $32.55 PSF, down 2.5% year-over-year. Vacancy declined 150 basis points to 18.2%, though tech-centric metros like Seattle lead with a 27.0% vacancy rate—set to worsen following planned layoffs from Amazon. In contrast, Miami and Manhattan maintain lower vacancies and higher listing rates, reflecting local market strength amid broader challenges for office values.
Construction Near Lows but Starts Tick Up
At the start of 2026, 28.9MSF of office space was under construction nationally—a 42.9% year-over-year decrease. However, 13.8MSF in new starts during the past 12 months marked an 18.5% increase, hinting at cautious optimism. New supply remains limited, and any sustained recovery in office values will depend on continued adjustment between demand and inventory.
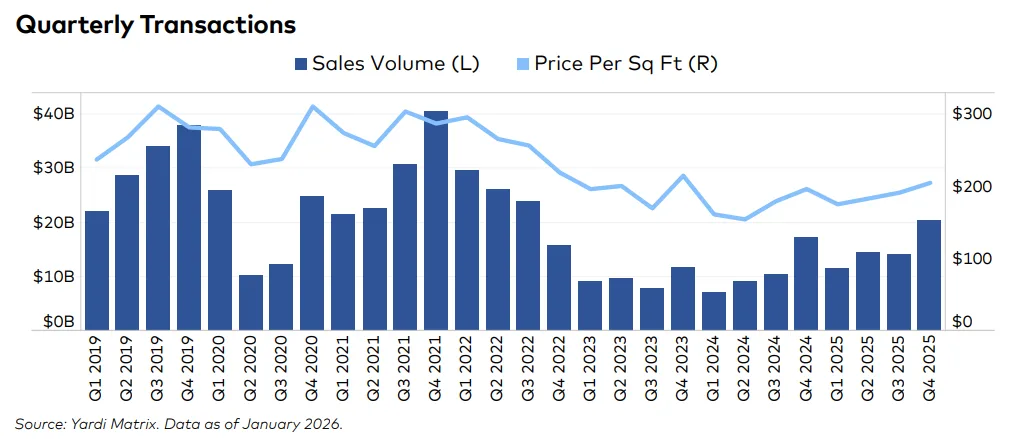
Transactions: Manhattan Takes the Lead
Yardi Matrix recorded 121 office transactions in January, totaling $4.0B in sales with an average price of $278 PSF. Manhattan tallied 73 sales in 2025 at an average $495 PSF—a 21.5% gain. The Park Avenue Tower deal at $730M reflected only a modest 7.5% discount from its 2014 price, reinforcing strong investor interest in resilient trophy assets even amid challenges for the broader office sector.
What’s Next
While office values are rising and vacancy is slowly improving, many metros remain well below pre-COVID levels. Continued elevated discounts and wide performance gaps indicate that the sector is still working through a multiyear transition, with a lasting rebound likely to require further shifts in tenant demand, developer strategies, and capital markets support for office values.