


- Life science development has slowed, with fewer new starts and deliveries concentrated in key markets.
- National office vacancy declined to 17.6%, while average listing rates dipped 1.9% year-over-year.
- Manhattan leads in new office construction, but supply pipelines remain at historic lows.
- Strong office sales recorded in Miami, with price per PSF up 20% over 2019 levels.
Life Science Development Eases
After a decade of rapid expansion, life science development is decelerating, according to Yardi Matrix. Since 2020, 47.3M SF of life science space was delivered, with annual deliveries peaking at 13.9M SF in 2024 before dropping to 11.2M SF in 2025. Current construction pipeline sits at 11.3M SF, indicating another decline in 2026. San Francisco, Boston, and San Diego account for most new supply, but new starts have dropped sharply—from 15.4M SF in 2022 to 2.4M SF in 2025.
Uncertainty over federal research funding contributes to the slowdown. Although Congress increased the NIH budget for FY2026, grant approvals are down and more competitive policies limit annual funding. Still, market fundamentals suggest the current life science overhang will be absorbed, with the sector remaining an important subset of office trends moving forward.
Office Market Listing Rates and Vacancy
As of February 2026, the national average full-service listing rate for office properties is $32.79 PSF, down 1.9% from last year. Vacancy fell to 17.6%, improving by 200 basis points year-over-year. Suburban Denver benefited from building removals and a shrinking pipeline, reducing vacancy to 19.8%. Across the top 25 metros, only eight now have office vacancy above 20%.
Get Smarter about what matters in CRE
Stay ahead of trends in commercial real estate with CRE Daily – the free newsletter delivering everything you need to start your day in just 5-minutes
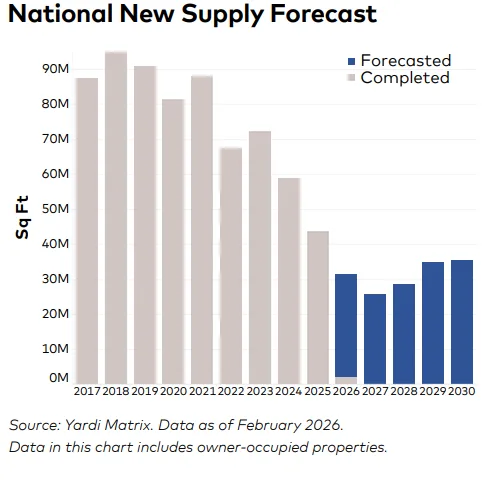
Supply Pipeline Stabilizes, Manhattan Leads
Office supply pipelines are steady after years of decline, with 28.2M SF under construction nationwide—just 0.4% of office inventory. Over the past 12 months, 13M SF of new office starts was recorded, with Manhattan leading all markets (2.3M SF in 2025 and new medical office starts in 2026). Most other markets have seen a sharp decline in large-scale office construction compared to pre-pandemic levels.
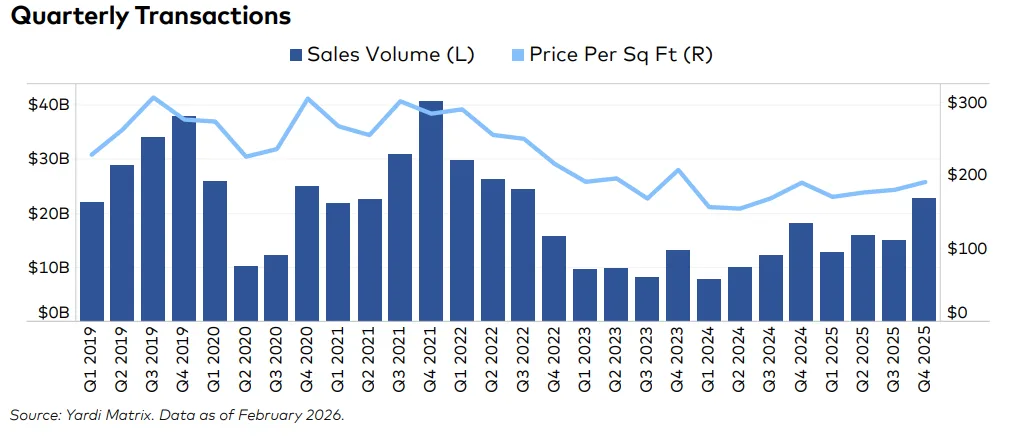
Miami Sees Robust Office Sales
Nationwide, 316 office transactions were logged YTD, totaling $7.8B and averaging $218 PSF. Miami stands out with $666M in 2026 sales to date—its highest quarterly sales since 2020. The market’s average PSF reached $475, up 20% versus 2019, highlighted by a $180M trade for a 325 KSF property at 545 NW 26th St. in January.
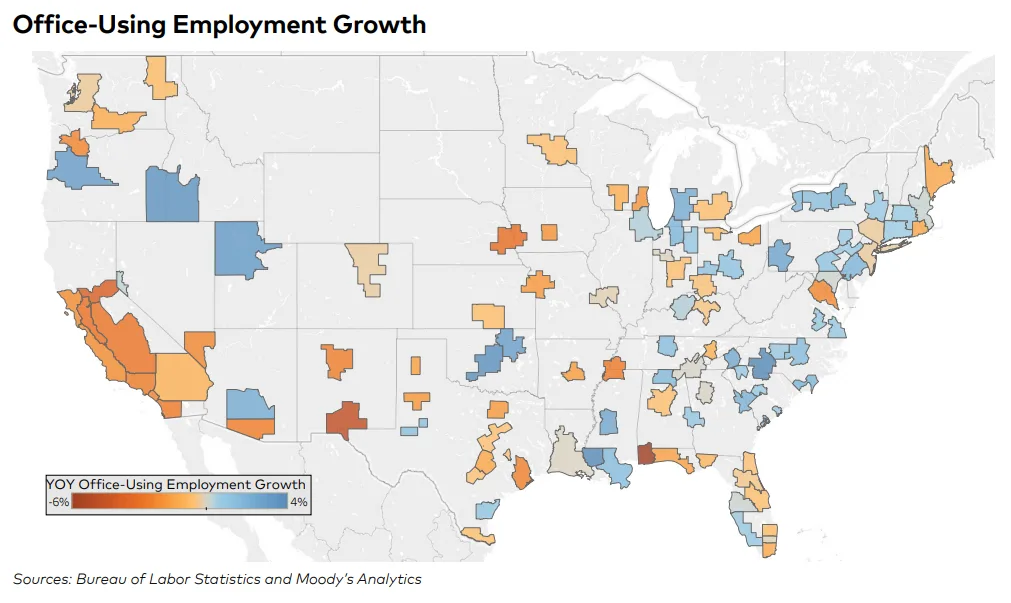
Office-Using Employment Mixed, Nashville Recovers
Office-using sectors lost 185,000 jobs year-over-year (-0.5%), even as total US employment rose slightly. Nashville stands out for office employment growth, up 1.3%—bucking the national trend and aided by new corporate arrivals. Among major metros, only seven posted positive year-over-year growth in office-using employment. This uneven performance comes as broader labor market conditions continue to play a critical role in shaping occupier demand across CRE sectors.
What’s Next
With life science demand easing and national office supply stabilizing, absorption trends and capital markets activity remain key indicators as 2026 progresses. Large markets like Manhattan and Miami are demonstrating resilience, while targeted building removals and adaptive reuse—especially in harder-hit downtowns—help bring vacancy rates down. Market observers expect further normalization across most office subsectors in the year ahead.