


- Office recovery is underway as rents in major US markets rebound, led by New York City and Dallas–Fort Worth.rn
- Hybrid work has stabilized, with remote days averaging ~27%, suggesting a new workplace equilibrium.rn
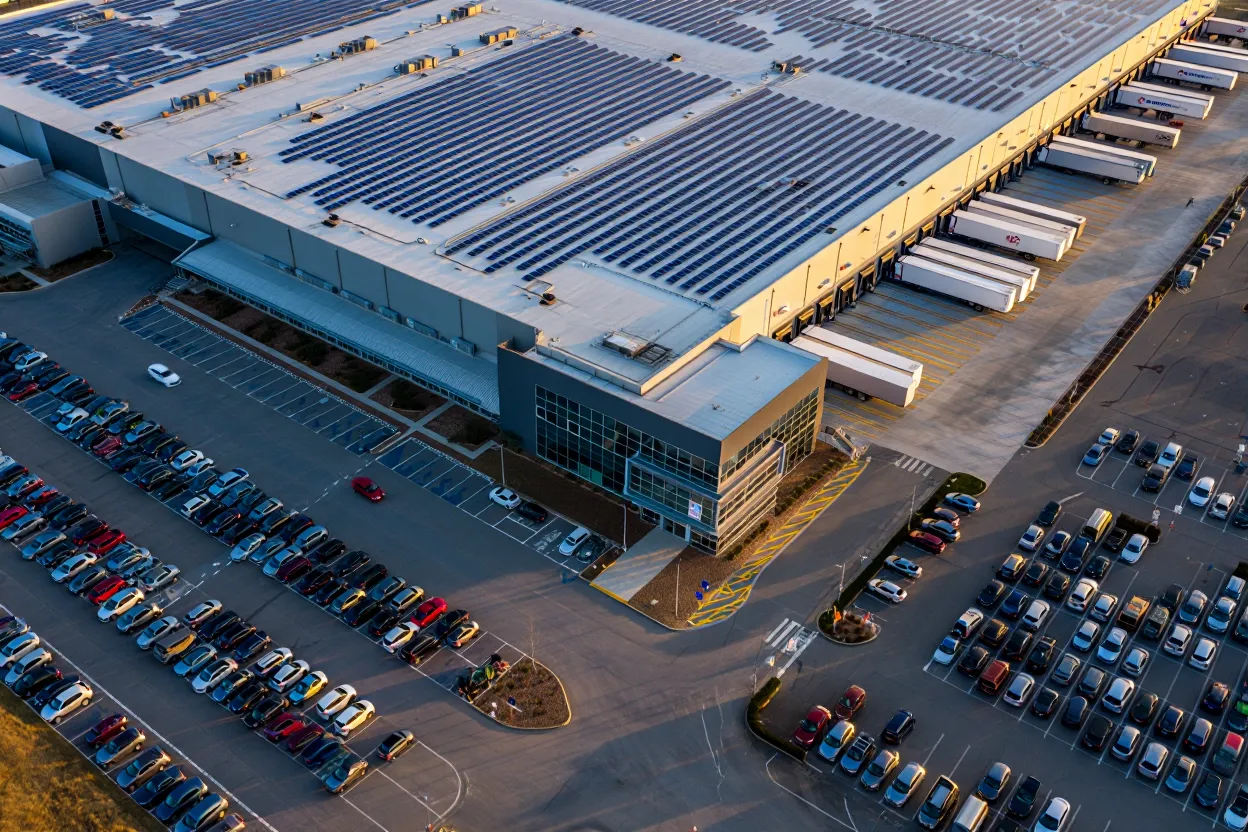
- Rising construction costs are limiting new supply and fueling tenant improvement expenses, tightening top-tier space availability.rnrnrn
- Class B assets gain traction, with rents surpassing pre-pandemic levels for the first time, signaling broader market recovery.rn
Stability Returns To The Office Sector, But At A New Normal
US office employment compstak.com/go/report-2025-mid-year-office-market-report” target=”_blank” rel=”noreferrer noopener”>increased by just 0.04% over the past year, reports Compstak. Meanwhile, job openings rose 0.4%, indicating a slight uptick in demand. The data suggests firms are approaching hiring with caution. Meanwhile, hybrid work appears to be settling into a post-pandemic equilibrium, with average work-from-home days holding steady at 27.7% year-to-date.
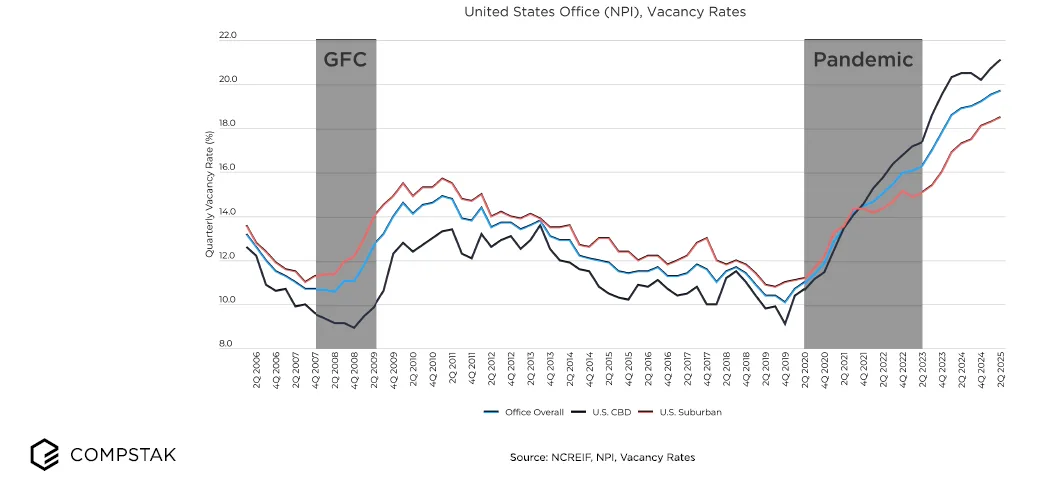
Despite this stability, office space demand has not fully recovered. Vacancy rates reached new highs in early 2025. Central Business Districts (CBDs) led the increase, with vacancy rising to 21.1%. This marked the first time CBD vacancies surpassed those in suburban markets. Suburban areas remained more resilient, with a vacancy rate of 18.5%.
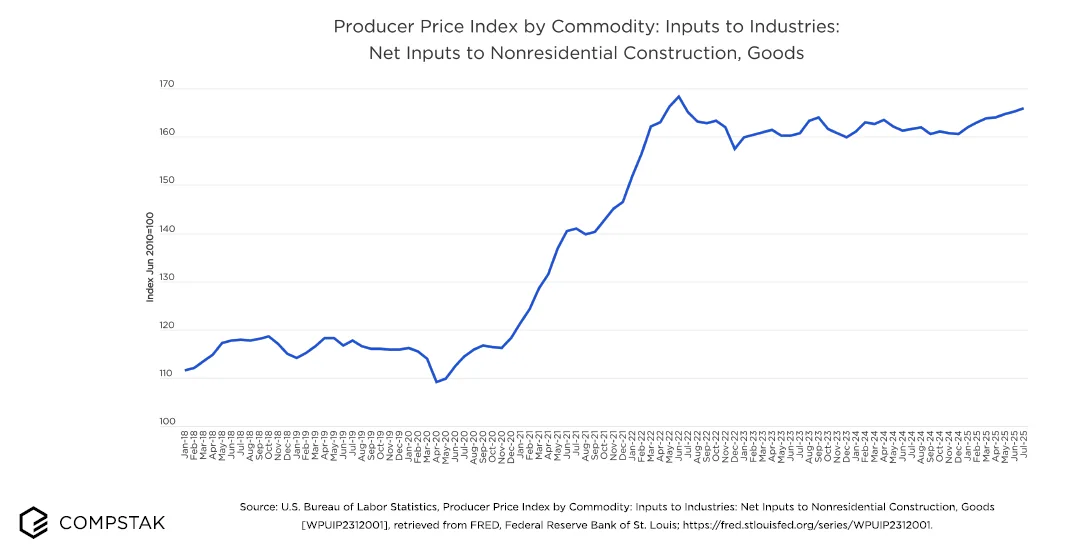
Construction Headwinds Could Limit Future Office Supply
Inflation is hitting construction hard. The Producer Price Index for nonresidential construction goods rose 2.6% from July 2024, marking the highest level in three years. These elevated input costs may constrain speculative developments and delay tenant improvements, which in turn could tighten future supply and sustain higher rents in prime locations.
Class A Lease Expirations Loom, Especially In 2026
A wave of lease rollovers is approaching. Over 57% of current leases are set to expire by the end of 2030, with Class A properties comprising the bulk. Expirations peak in 2026, potentially creating spillover demand into Class B/C properties—especially as high construction costs limit new space delivery.
Traditional Tenants Drive Leasing, While Public Sector Pulls Back
Office leasing in 2025 has been led by traditional sectors. The FIRE (finance, insurance, real estate) sector claimed 31.5% of new leases, a major jump from 22.7% in 2024. Legal services held strong at 13.5%, while the TAMI (tech, advertising, media, information) sector began to recover, rising to 19.9%. In contrast, government and nonprofit leasing plunged to 2.2%, down from 7.1% in 2024.
Get Smarter about what matters in CRE
Stay ahead of trends in commercial real estate with CRE Daily – the free newsletter delivering everything you need to start your day in just 5-minutes
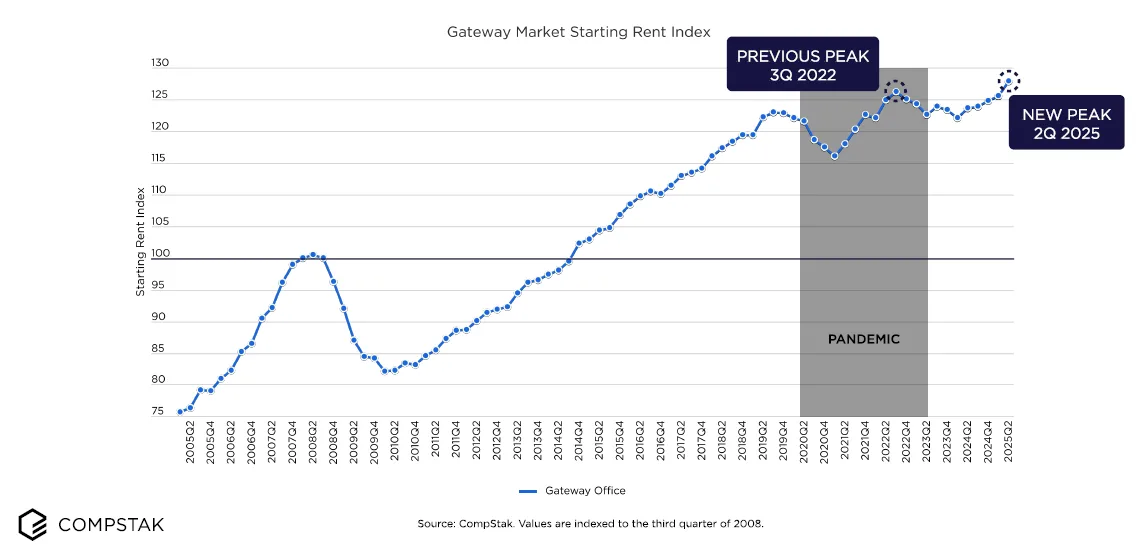
Rent Recovery Is Uneven Across Markets And Building Classes
Effective rents for Prime Class A buildings surpassed Q4 2019 levels, driven by trophy deals over $200 PSF in key markets like NYC and Silicon Valley. However, growth is beginning to spread to Class B+ assets as well. For the first time, average rents across the entire Class B segment exceeded 2019 levels.
Still, free rent and tenant improvement incentives are diverging. Free rent periods remained steady in Class A but increased sharply in Class B buildings. Work value concessions, especially in non-Prime Class A and B/C space, continued rising, fueled by high construction costs and tenant expectations.
San Francisco Struggles While Dallas And NYC Lead Recovery
More than half (54.8%) of gateway midmarkets show potential for rent growth, particularly in Boston, Dallas–Fort Worth, and Chicago. In contrast, San Francisco, Brooklyn, and Washington, DC lag, with in-place rents outpacing market estimates. Notably, Dallas and NYC were the only two gateway markets to show full rent recovery across both Class A and B/C segments.
Why It Matters
The bifurcation between top-tier and lower-tier assets is narrowing, and more balanced recovery across asset classes may reshape future leasing decisions. Yet, rising construction costs and the looming Class A lease expirations could challenge both landlords and tenants in the coming quarters.
What’s Next
With more than half of all office leases expiring by 2030 and new construction hampered by costs, competitive dynamics will shift. Developers and landlords may increasingly focus on upgrading existing assets rather than building new. Meanwhile, markets showing early signs of rent growth—particularly in the Midwest and Sun Belt—could attract the next wave of occupiers.