


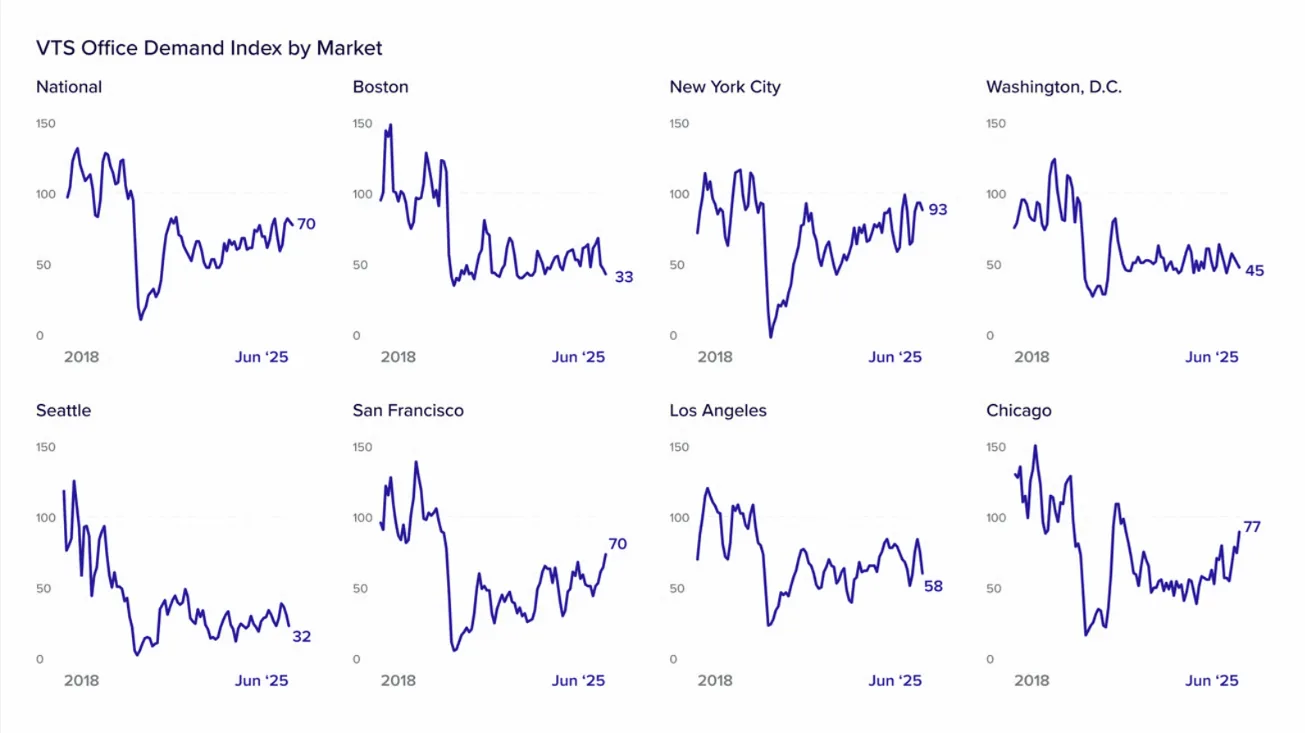
- Office demand rose 11.1% year-over-year nationally, but dipped slightly from Q1.
- Chicago and San Francisco led Q2 growth, driven by tech and professional services.
- Washington, DC, Los Angeles, and Boston saw major quarterly and annual declines.rn
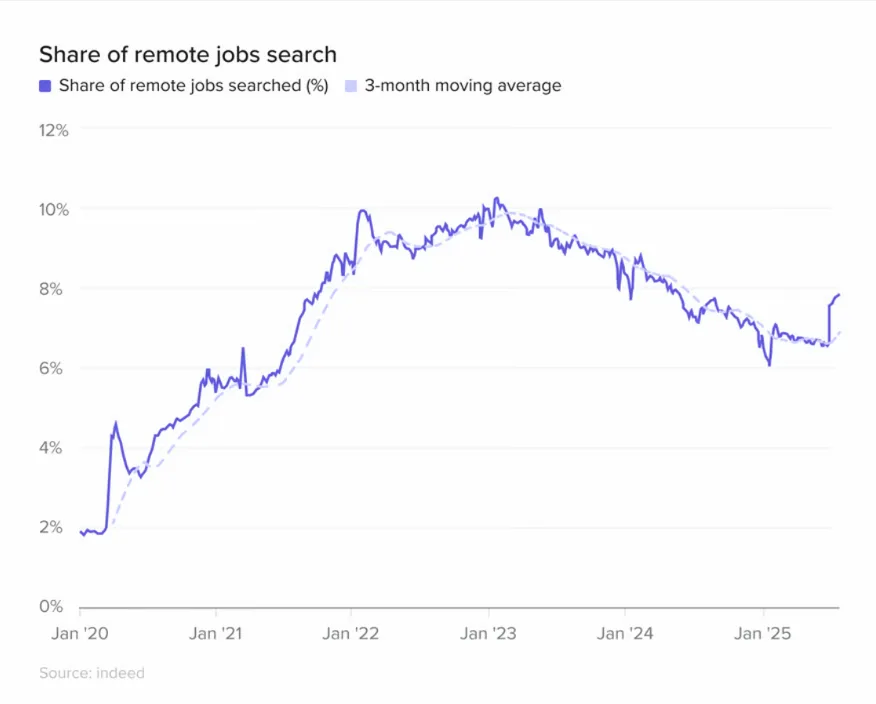
- Remote work interest rose again, complicating return-to-office strategies.
A Mixed National Picture
The national VTS office demand Index (VODI) ended June 2025 at 70, up from 63 one year earlier, marking an 11.1% year-over-year increase, reports VTS. However, demand slipped 1.4% from March, as global trade uncertainty, AI-related disruptions, and geopolitical tensions weighed on business confidence.
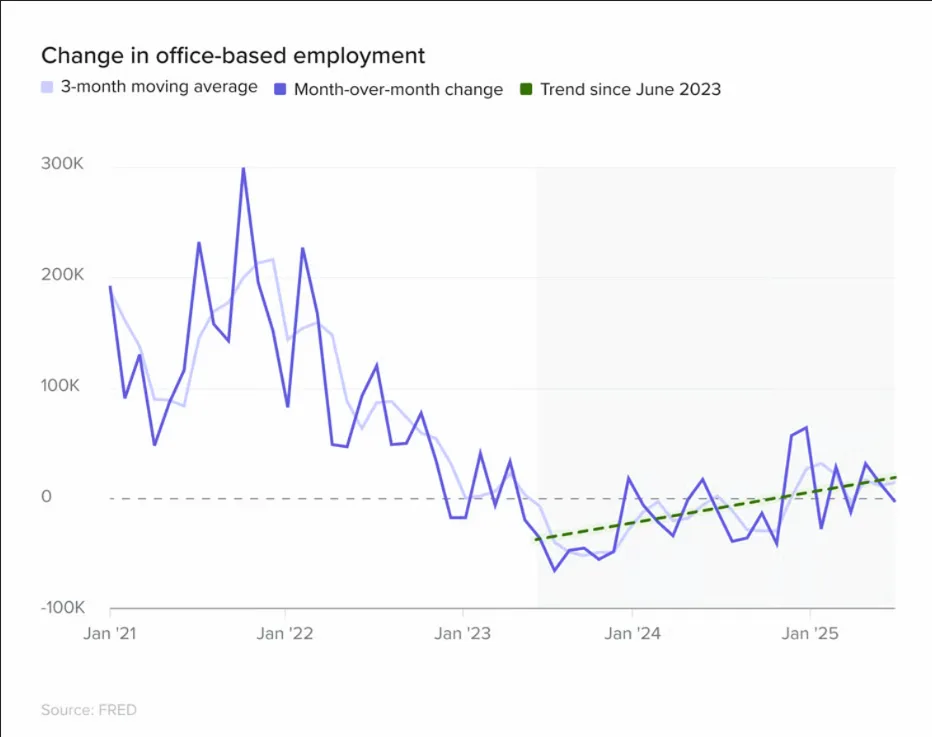
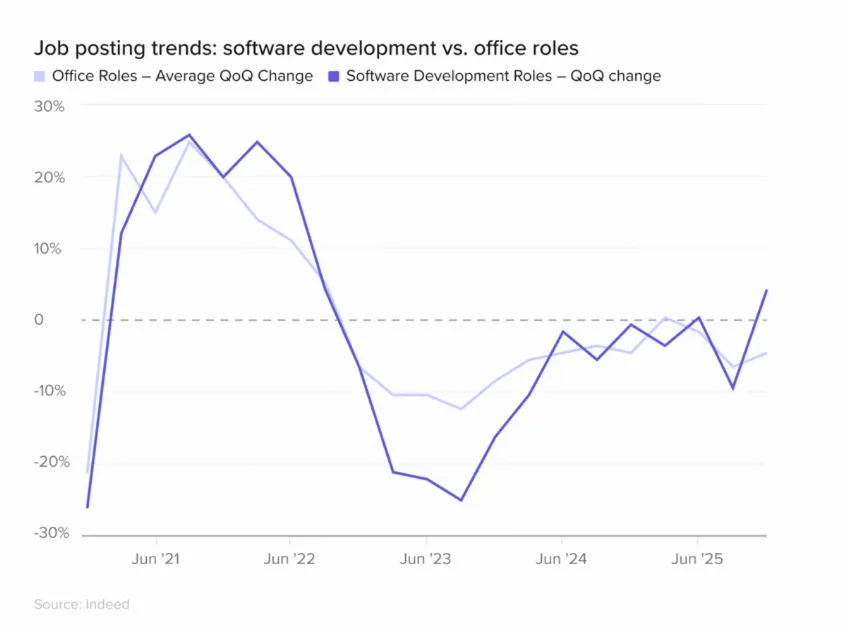
Job postings across the board cooled by 2.4% during Q2, marking the lowest level in the post-pandemic period. Despite this decline, office-using sectors added 47K jobs during the quarter. This gain reversed a contraction seen earlier in the year. Meanwhile, the remote work pendulum swung slightly back. Job searches for remote positions rose from 6.7% to 7.8%. This shift reflects ongoing friction between employer mandates and employee preferences.
A Tale Of Two Trajectories
Winners: Chicago and San Francisco
Chicago led all markets with a 60.4% year-over-year increase in office demand and a 35.1% jump from Q1, fueled by robust growth in legal and finance sectors. Despite the strong performance, it’s unclear if this is a structural shift or a short-term boost from a few large tenants.
San Francisco saw a 27.3% annual rise and a striking 40% quarter-over-quarter gain—largely due to tech firms, particularly those driving AI-related expansion. This marks one of the strongest quarterly rebounds in the city since the pandemic low.
Mixed Signals: New York City and Seattle
New York City posted a 17.7% increase year-over-year but only grew 1.1% from Q1. While finance remained the dominant sector by volume, it contracted slightly, offset by rising demand in tech and legal.
Seattle showed an 18.5% annual rise, but office demand fell 38.5% from Q1, reflecting volatility in the city’s downtown core. Notably, the Metroeast submarket has captured more tech demand, indicating a possible geographic shift in tenant interest.
Get Smarter about what matters in CRE
Stay ahead of trends in commercial real estate with CRE Daily – the free newsletter delivering everything you need to start your day in just 5-minutes
Coastal Cooldown
Washington, DC
Office demand in the nation’s capital dropped 26.2% year-over-year and 21.1% from March. Weakness in public sector–linked industries and restrained federal spending dragged the market down, despite modest gains in legal and nonprofit demand.
Los Angeles
L.A. saw demand plunge 25.6% year-over-year and 22.7% quarter-over-quarter. Factors include post-strike instability in the entertainment sector, streaming slowdowns, and sociopolitical unrest impacting downtown traffic.
Boston
Boston posted one of the steepest quarterly declines, with demand falling 45.9% since March and 25% year-over-year. Large tenants have mostly exited the market, ending a multi-quarter run of 2M+ SF of new demand.
Why It Matters
Office demand stability at the national level is masking increasingly divergent local market dynamics. Cities like Chicago and San Francisco are seeing a resurgence of demand driven by specific sectors like tech and professional services. Others, like Boston and DC, are grappling with weakened tenant pipelines and sector-specific slowdowns.
What’s Next
The post-pandemic office recovery remains uneven. As AI adoption reshapes work patterns and companies recalibrate their space needs, expect further market-level volatility. National stability may continue, but the spread between winners and laggards could grow even wider in the quarters ahead.