


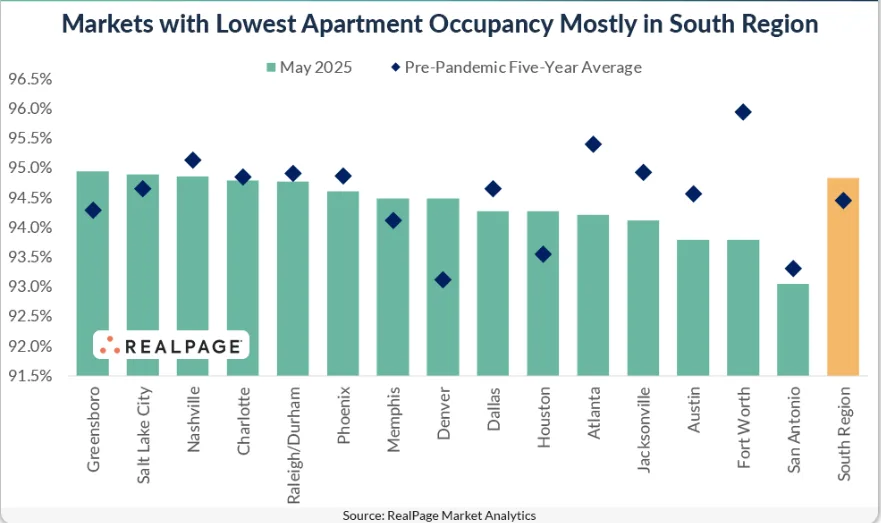
- Occupancy in the South dipped 170 basis points year-over-year to 94.8% in May—80 bps below the national average.
- The South was the only US region with occupancy rates under the national benchmark, with 12 of the 15 lowest-performing markets located there.
- San Antonio, Austin, and Fort Worth were among the weakest, each falling below their pre-pandemic occupancy averages despite notable demand.
A Regional Slowdown
Apartment occupancy across the South fell to 94.8% in the year-ending May, marking a 170-basis-point drop, reports RealPage. The region now sits 80 bps below the national average of 95.7%. This makes the South the only US region currently underperforming relative to the national norm.
How It Compares
The South’s occupancy rate lags notably behind the Northeast (97.1%), Midwest (96.5%), and West (95.8%). While the South is still operating above its own pre-pandemic five-year average of 94.5%, over 80% of its markets are trailing national levels.
Get Smarter about what matters in CRE
Stay ahead of trends in commercial real estate with CRE Daily – the free newsletter delivering everything you need to start your day in just 5-minutes
Market-Level Drag
San Antonio posted the lowest occupancy nationwide in May at 93.1%, slightly below its historical average of 93.3%. The market’s 35% increase in total units since 2020 has diluted occupancy despite strong renter demand.
Other lagging markets include Austin and Fort Worth, each sitting at 93.8%. For Fort Worth, this marks a more than 200-bps decline from its pre-pandemic norm, while Austin saw an 80-bps drop. Jacksonville (94.1%) and Atlanta (94.2%) rounded out the bottom five, with both markets also performing below their historical averages.
Wider Implications
In total, 12 of the 15 lowest-occupancy large markets in the US were in the South in May. Other underperforming metros—such as Salt Lake City (94.9%), Phoenix (94.6%), and Denver (94.5%)—are also seeing softening, but the South remains the clear outlier.
Why It Matters
The disconnect between demand and occupancy underscores the challenge of balancing supply growth in fast-growing Sun Belt markets. While new units cater to long-term growth, short-term pressure on occupancy rates may weigh on rents and investment performance.
Looking Ahead
Unless absorption picks up meaningfully, markets with significant construction pipelines—like San Antonio, Austin, and Fort Worth—could continue to face occupancy headwinds through the remainder of 2025.