


- Net-lease investment volume rose 9% year-over-year in Q1 2025 to $9.6B, with full-year volume climbing 21% to $44.6B.rn
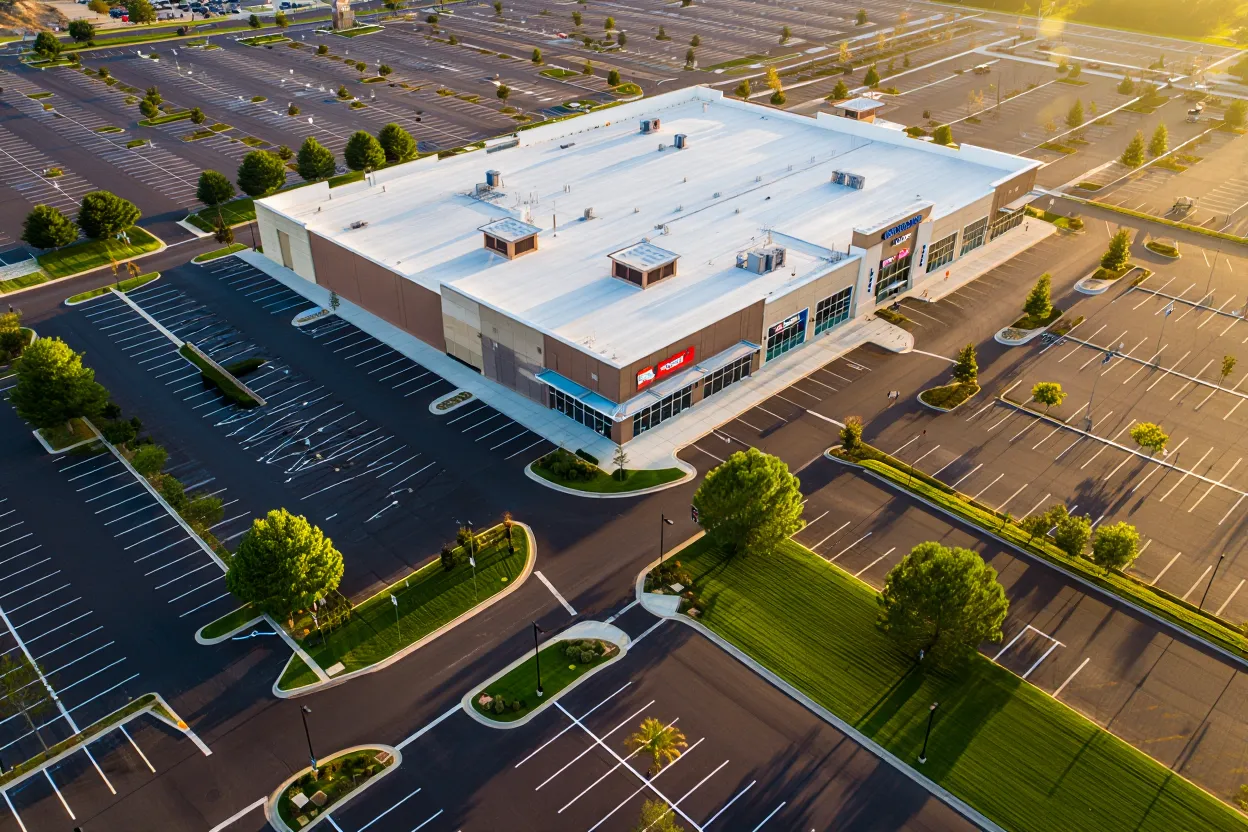
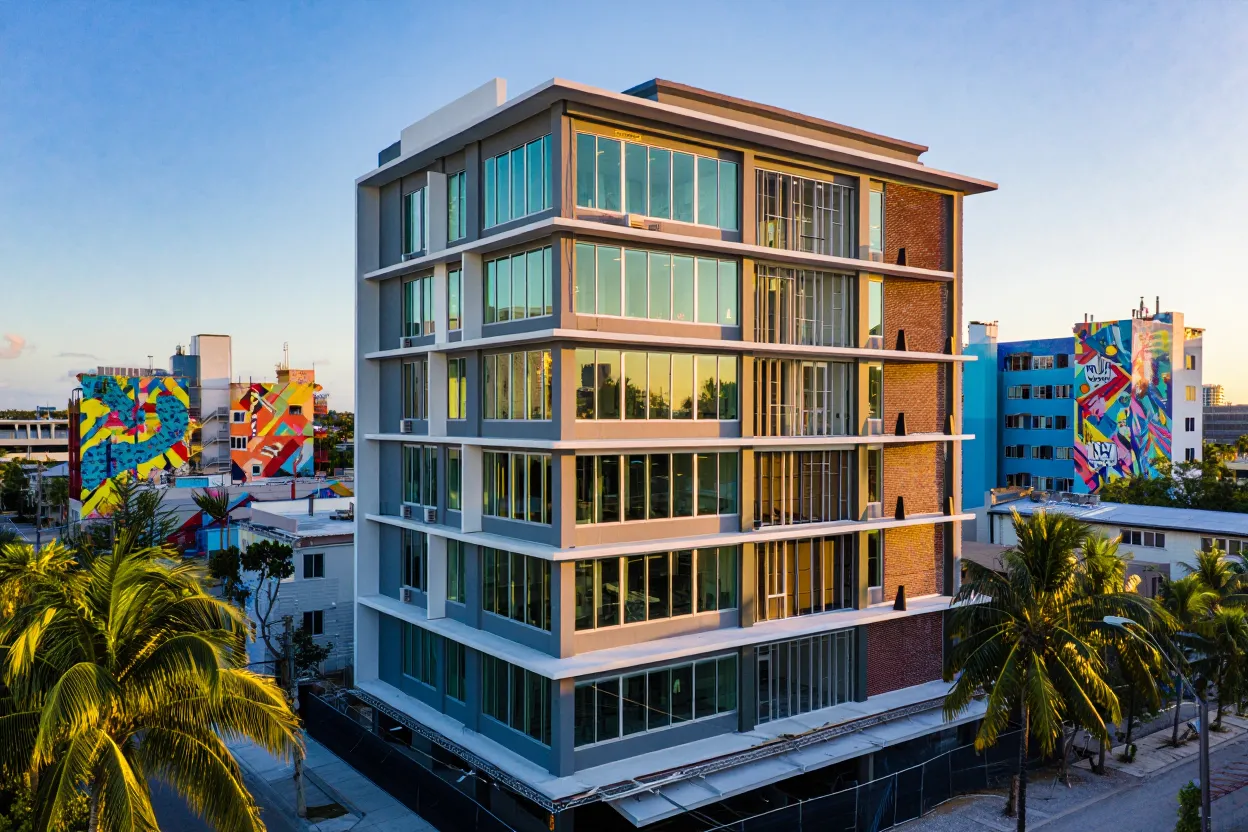
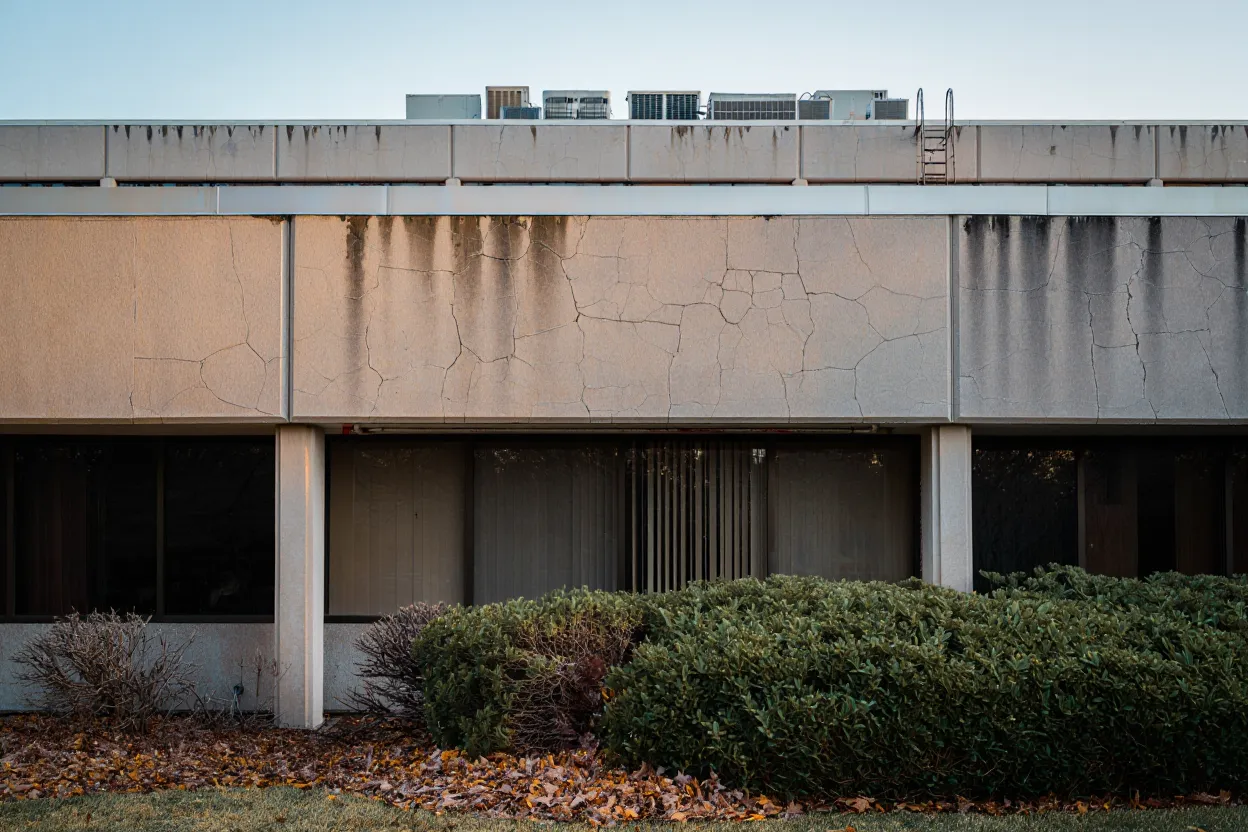
- Retail net-lease activity led the quarter with a 38% surge, while office investments declined by nearly 30%.rn
- Cap rates averaged 7.0%, showing signs of stabilization despite year-over-year increases.rn
Investment Recovery Continues
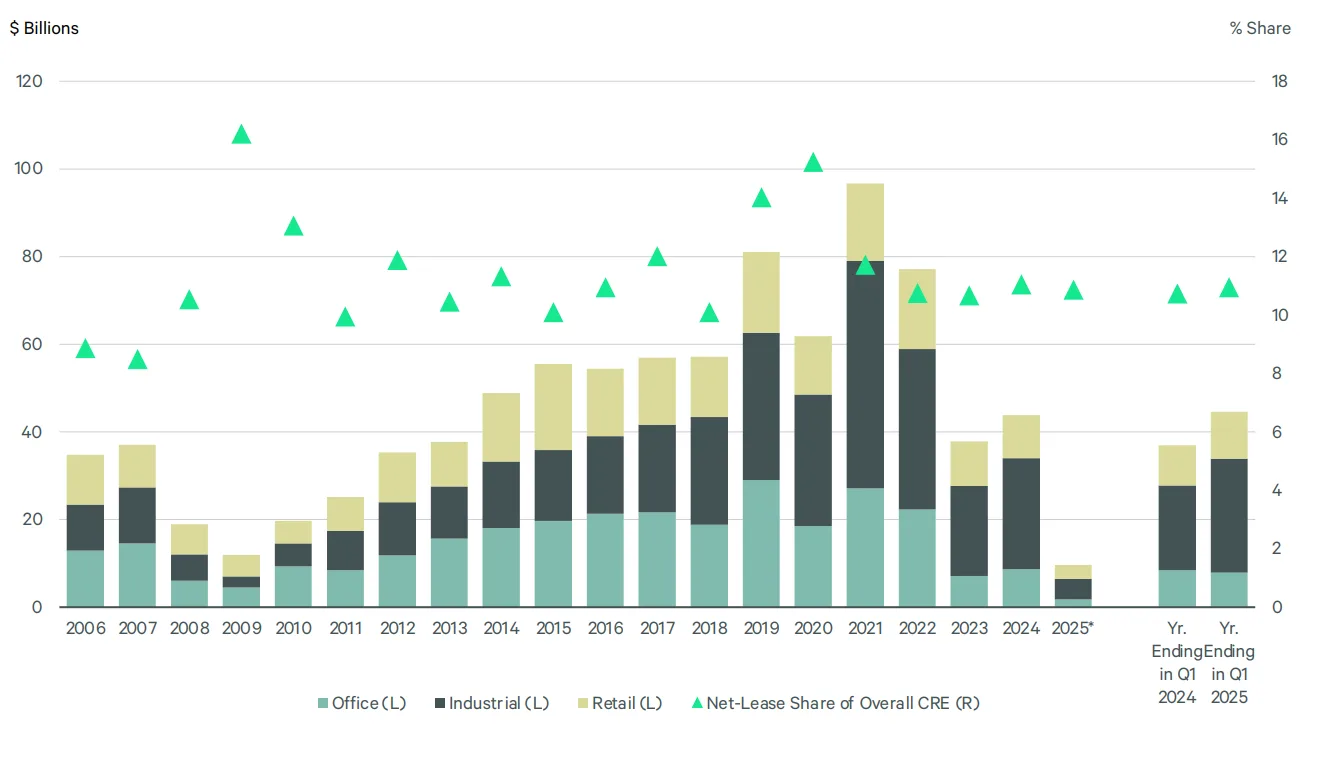
As reported by CBRE, after several challenging quarters, the net-lease sector extended its rebound in Q1 2025. Investment volume rose to $9.6B, representing a 9% increase compared to the same period last year. Moreover, on an annual basis, net-lease activity totaled $44.6B—up 21% from the previous year—outpacing the broader commercial real estate market, which grew 18%.
Shifts Across Sectors
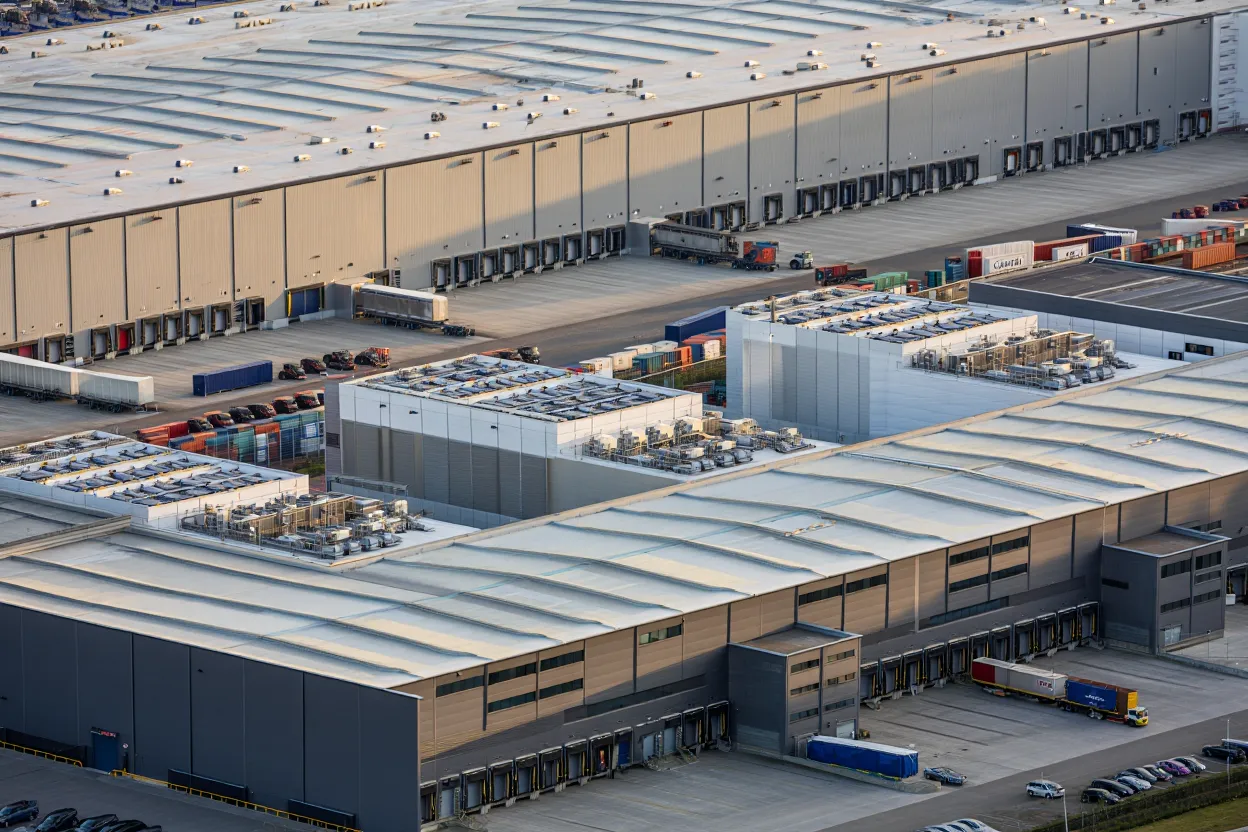
When broken down by property type, industrial and logistics assets remained dominant, comprising 49% of total net-lease volume. Meanwhile, the retail sector gained traction, increasing its share to 32%, up from 25% a year ago. Conversely, office investments continued to struggle, falling to just 19% of the market from 29% in Q1 2024. These shifts highlight changing investor preferences amid evolving market conditions.
Get Smarter about what matters in CRE
Stay ahead of trends in commercial real estate with CRE Daily – the free newsletter delivering everything you need to start your day in just 5-minutes
Cap Rate Movements
In terms of pricing trends, the average cap rate rose to 7.0%, up 48 basis points from the prior year. Notably, the pace of cap rate increases has slowed since Q2 2023, suggesting that stabilization is underway. Retail assets experienced the largest increase, with cap rates climbing from 6.4% to 7.0%. Similarly, office cap rates rose from 6.9% to 7.3%, while industrial rates edged up modestly from 6.5% to 6.6%.
Investor Activity and Trends
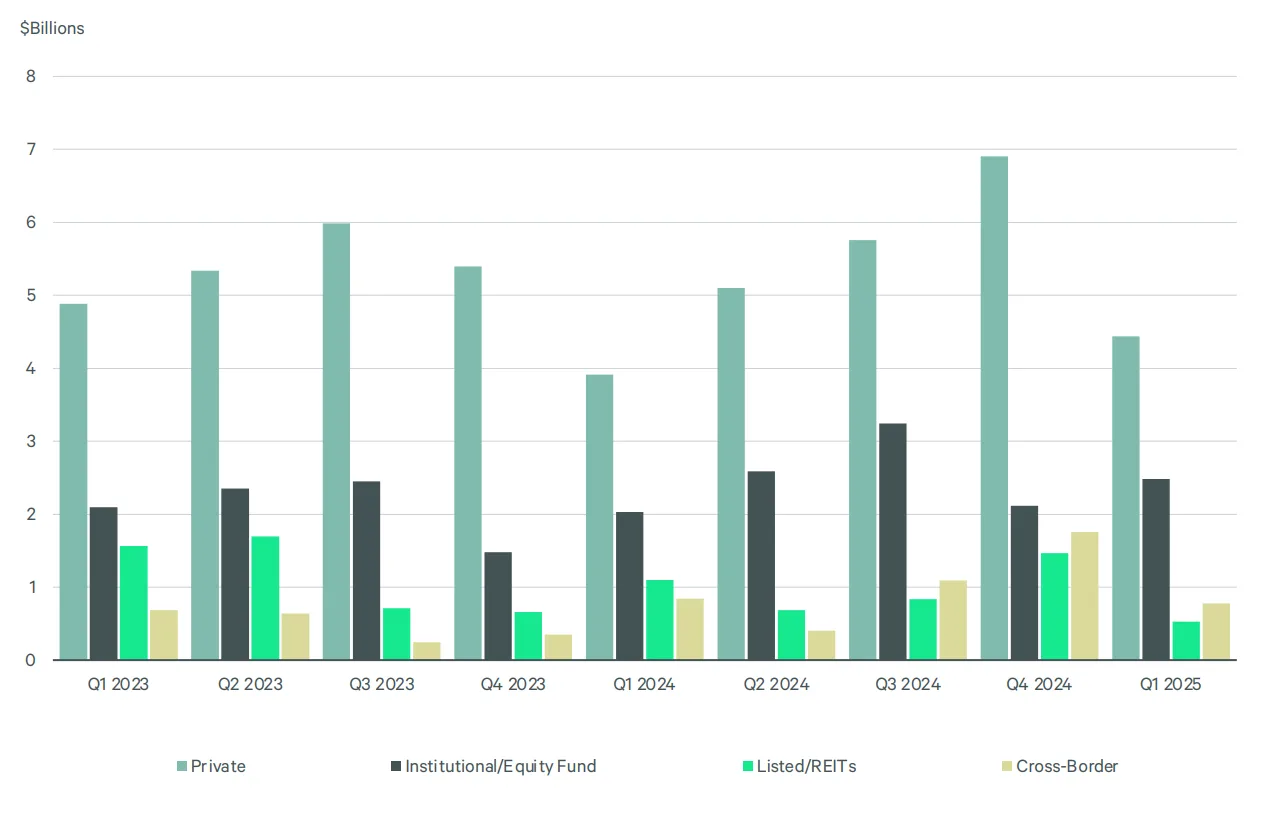
Private buyers remained the largest group of net-lease investors, contributing $4.4B in Q1—up 13% year-over-year. At the same time, institutional and equity fund investments grew by 22%, reaching $2.5B. On the other hand, investment from REITs declined 16%, and cross-border activity dropped 8%, although foreign capital still made up 8% of the total market.
Top Regional Markets
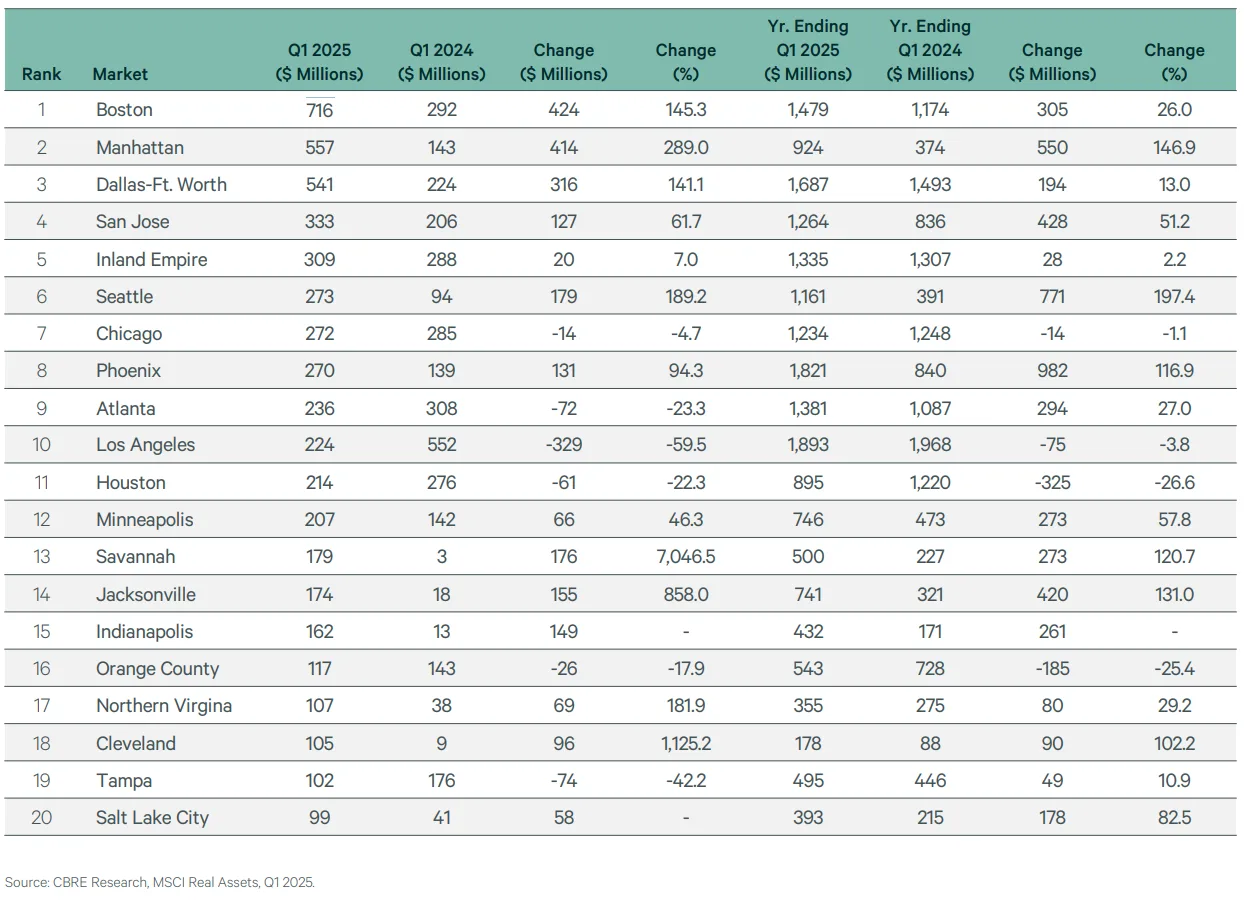
Regionally, several markets saw notable gains. For example, Boston led the nation with $716M in investment, a 145% increase year-over-year. Manhattan and Dallas-Ft. Worth also posted significant gains, with Manhattan experiencing a nearly threefold increase. These cities benefited from both strong fundamentals and renewed investor interest.
Rise of Sale/Leasebacks
Another trend gaining momentum is the use of sale/leaseback transactions. Volume in this category jumped 54% in Q1 to $1.8B, accounting for 19% of all net-lease activity. As borrowing costs remain high and capital access tightens, more companies are leveraging sale/leasebacks to unlock liquidity. For investors, the appeal lies in the stable income stream and long-term lease structures these deals often offer.
Why It Matters
Overall, the Q1 data underscores how resilient and attractive the net-lease sector remains. In a climate marked by elevated interest rates and cautious lending, investors are increasingly drawn to the relative safety and predictability that net-lease assets provide.
What’s Next
Looking ahead, conditions remain favorable for continued growth. The 10-year Treasury yield is expected to stay slightly above 4%, allowing spreads to remain healthy and encouraging further capital deployment. Additionally, as more investors seek stable, yield-generating opportunities, net-lease and sale/leaseback activity are poised to expand further throughout 2025.