


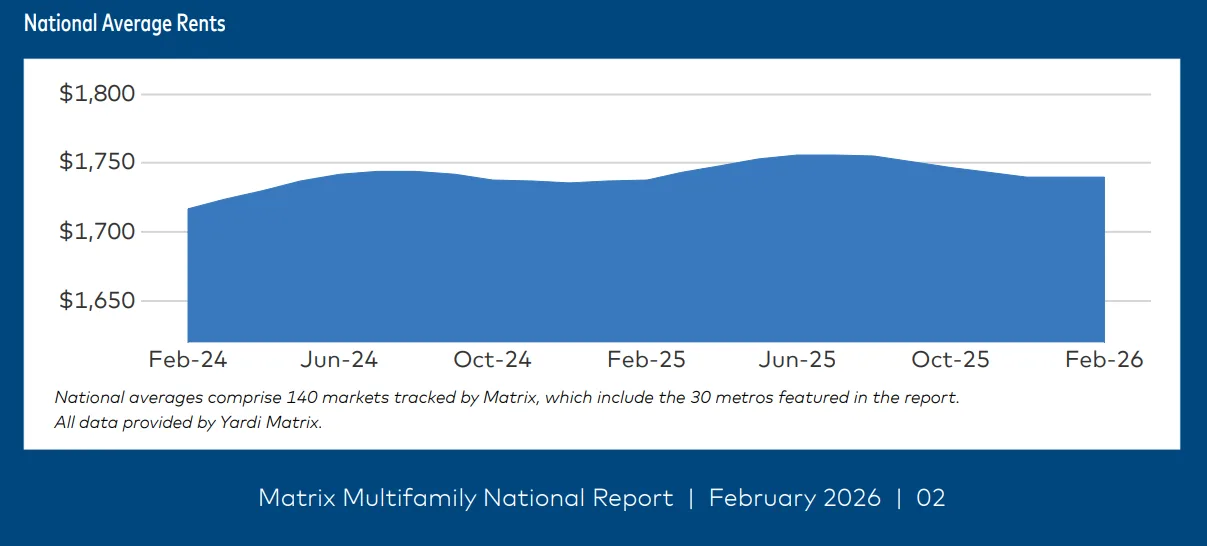
- Multifamily rents were flat at $1,740 in February 2026, marking 18 months of stagnation.
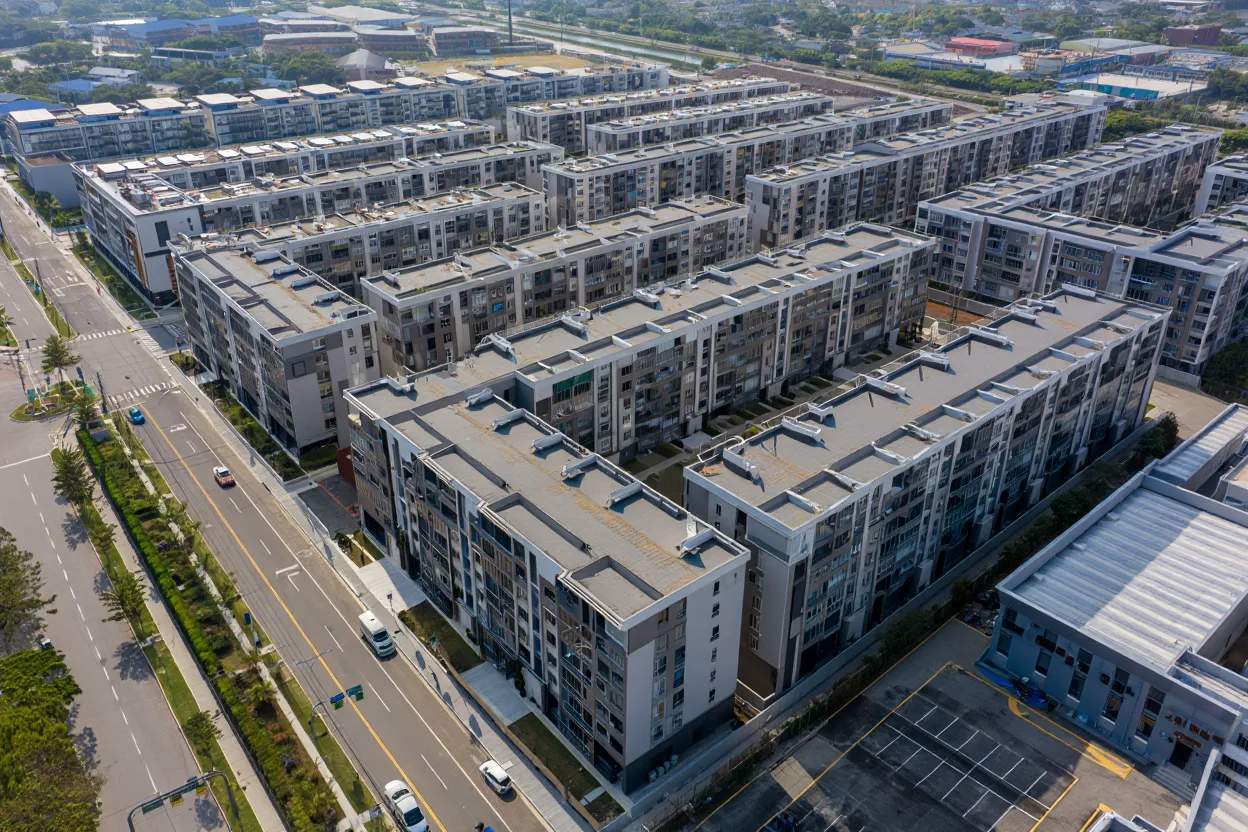
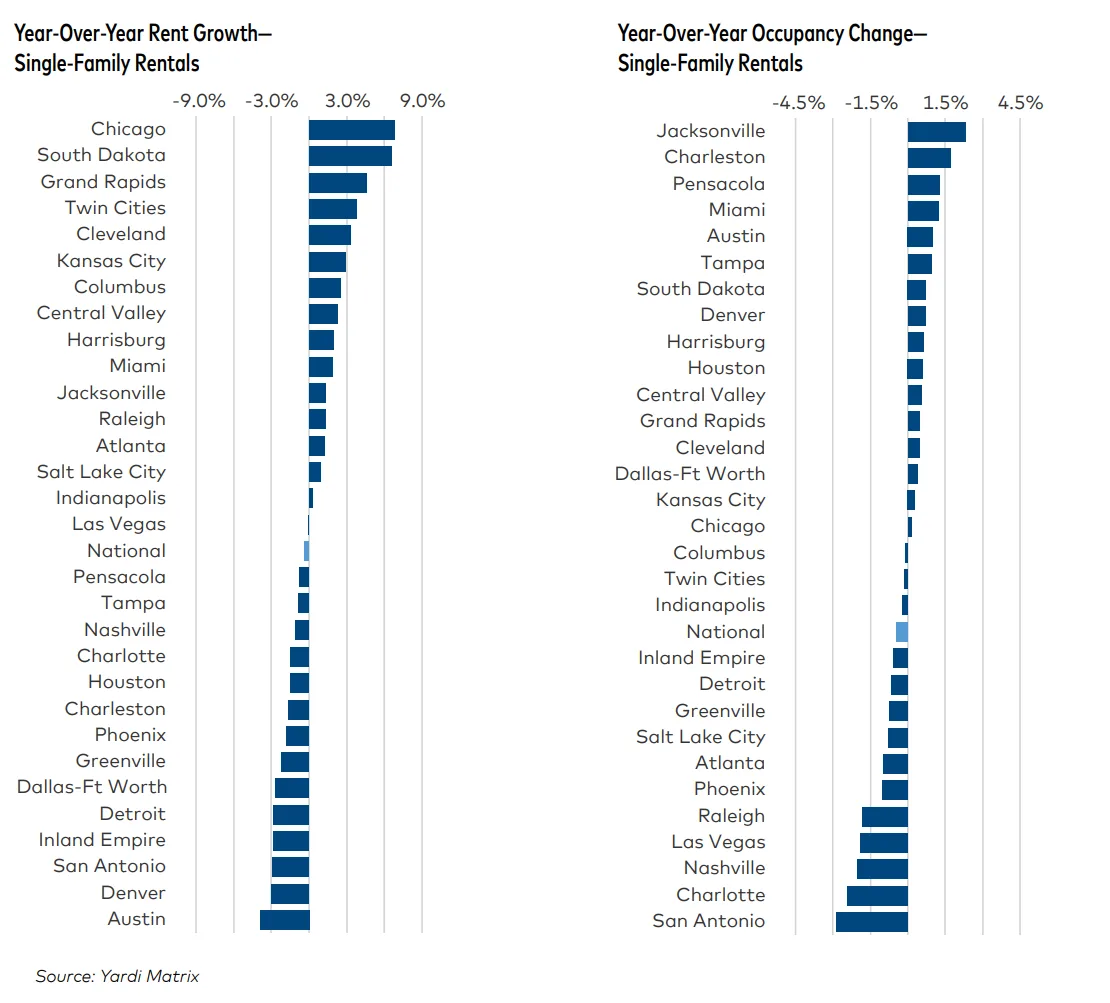
- Occupancy rates declined year-over-year in 28 of the top 30 metros, driven by high new supply.
- Population and domestic migration growth slowed, reducing apartment demand in key markets.
- Sun Belt metros continue to face the steepest pressure from supply and softening demand.
Muted Rent Performance Continues
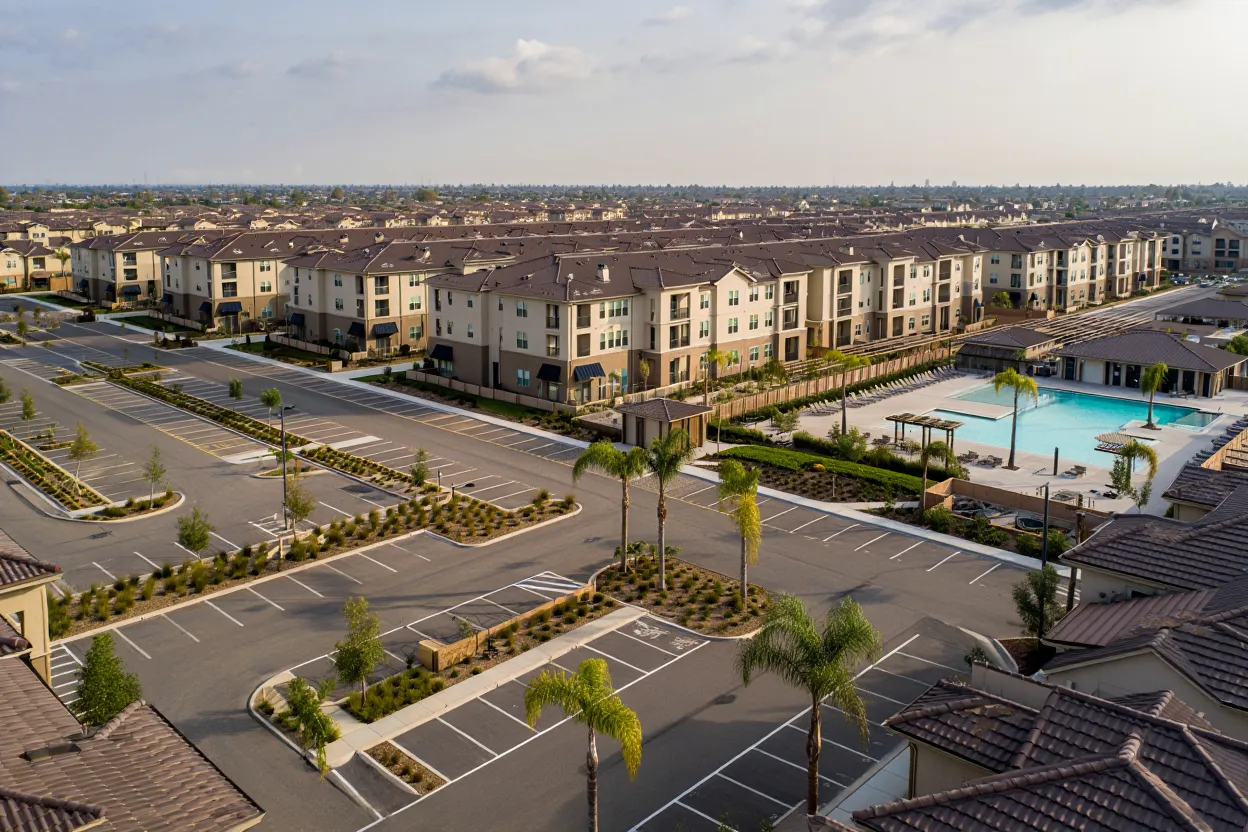
Yardi Matrix reports that multifamily trends nationwide show a sustained slowdown, with average US advertised rents unchanged at $1,740 in February 2026. This marks a year and a half of steady rents, as absorption slows and new supply remains elevated, particularly in Sun Belt metros. Year-over-year rent growth slipped to 0.1%, and occupancy rates dropped by 0.4% to 94.3% nationally.
Demand Headwinds and Demographic Shifts
Apartment demand is being dampened by a combination of factors. Recent Census data shows that US population growth—from July 2024 to July 2025—was the lowest since the pandemic, due in part to a marked decline in both immigration and birth rates. Domestic migration, which previously fueled leasing in Sun Belt and Mountain West states, has slowed sharply compared to pre-2023 levels. This slowdown also aligns with broader signs that rent growth across the US has started to level off after several years of rapid increases.
Get Smarter about what matters in CRE
Stay ahead of trends in commercial real estate with CRE Daily – the free newsletter delivering everything you need to start your day in just 5-minutes
Regional Variance and Supply Pressures
While core gateway markets such as New York (4.2% YoY), San Francisco (3.6%), and Chicago (3.5%) led rent growth, nearly all high-supply metros saw negative rent trends. Austin (-5.2%), Phoenix (-3.6%), and Denver (-3.2%) recorded the sharpest rent declines and occupancy drops, as leasing activity struggled to keep pace with deliveries. Midwest markets like the Twin Cities and Kansas City remained more stable, buoyed by moderate demand and lower new supply.
Market Outlook and What’s Next
Despite ongoing softness, multifamily trends still show resilience. Lease renewal rates remain strong, and capital stays available for well-located assets and value-add deals.
However, slower economic growth and rising energy prices create new pressure on the sector. Persistent supply levels also threaten to keep rents flat through the peak 2026 leasing season. As a result, operators should closely track shifts in population growth and migration patterns. These trends will help guide strategies and align decisions with local market conditions