


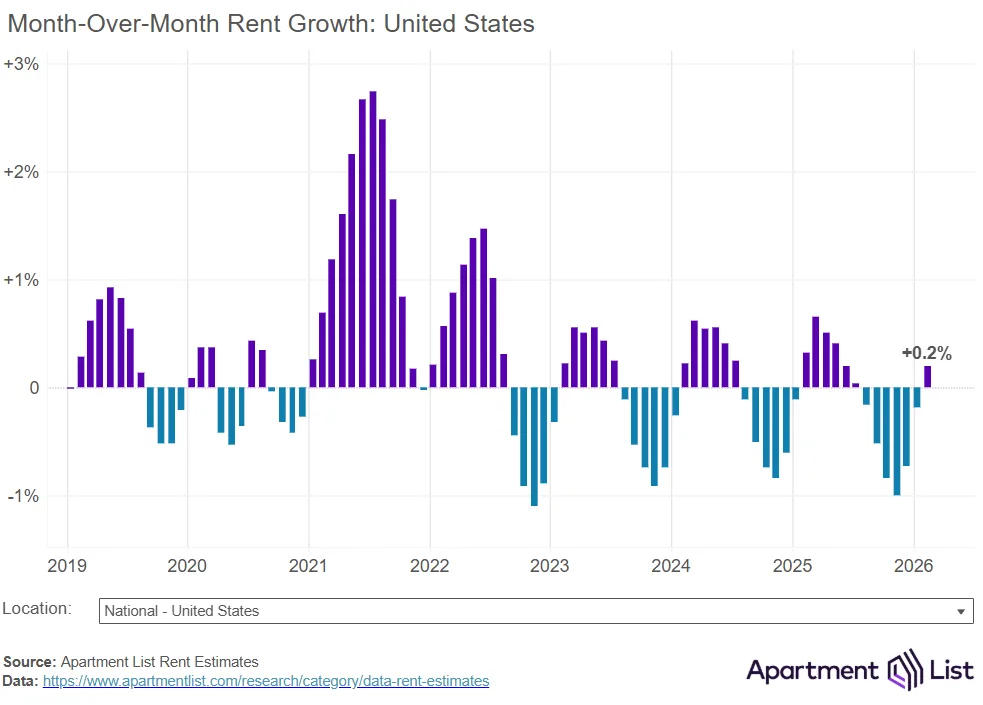
- National median rent in February rose 0.2% month-over-month to $1,357, but remains down 1.5% year-over-year.
- Multifamily vacancy reached 7.4%, a record high for Apartment List’s index since 2017.
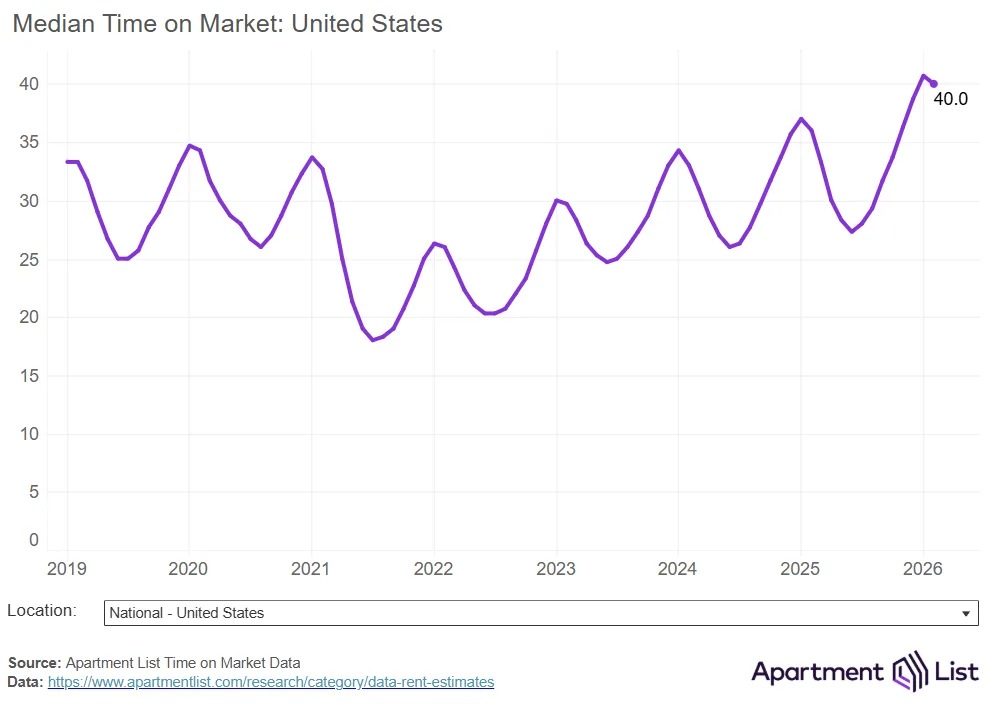
- Units are taking 40 days on average to lease, the longest February average since 2019.
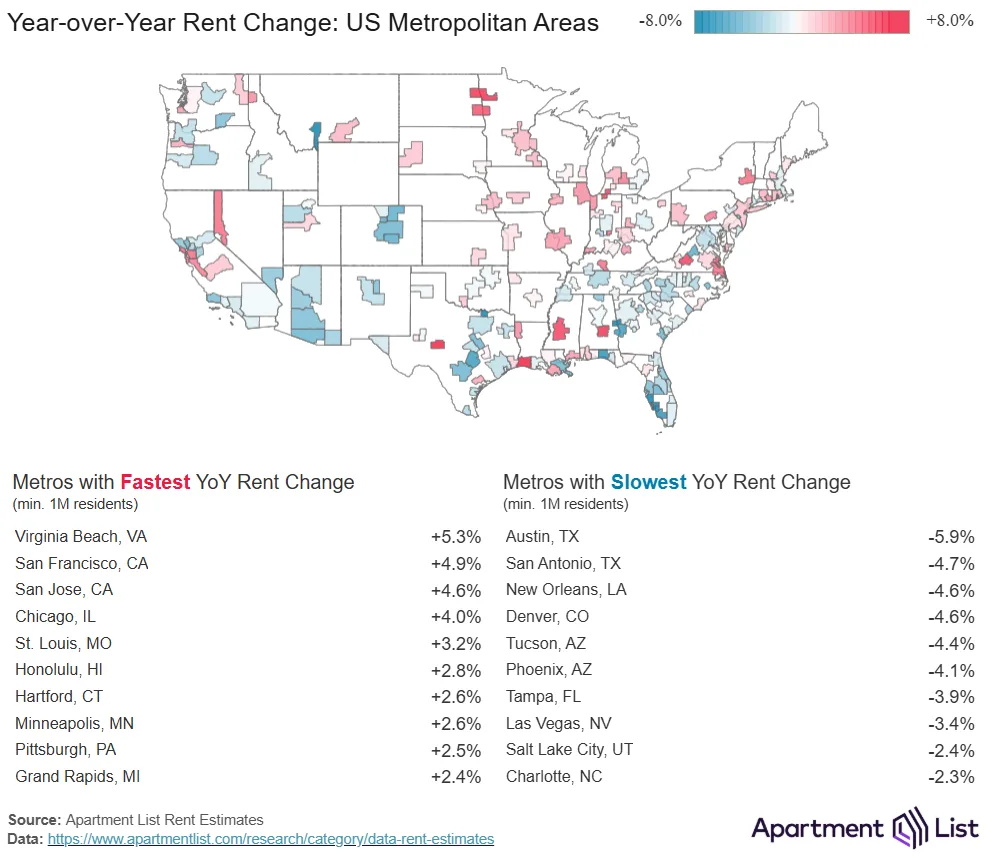
- Sun Belt metros, especially Austin, lead rent declines, while Virginia Beach posts the highest growth at 5.3%.
Modest Rent Growth Returns
After six consecutive monthly declines, the national median rent increased 0.2% in February 2026, according to the latest Apartment List data. Despite this uptick, year-over-year rent growth remains negative at -1.5%. Monthly rent growth appears to follow typical seasonal patterns, with February reliably marking the start of rent increases as moving activity picks up toward the summer peak.
Record Vacancy Rates in Multifamily
Multifamily trends remain weak, with national vacancy ticking up to 7.4%. This is the highest vacancy rate recorded by Apartment List’s index since it began in 2017. Elevated new supply, added by over 600K new units in 2024 and sustained deliveries in 2025, continues to outpace demand, leading to more competition among landlords and slower unit absorption. Recent reporting has similarly highlighted how rising vacancies are amplifying rent declines across several major metros, underscoring the pressure facing landlords in today’s supply-heavy environment.
Get Smarter about what matters in CRE
Stay ahead of trends in commercial real estate with CRE Daily – the free newsletter delivering everything you need to start your day in just 5-minutes
Leasing Takes Longer as Demand Cools
The average time for a multifamily unit to lease now stands at 40 days. This marks a significant increase from mid-2021, when market turnover was twice as fast. Despite a slight improvement from last month, this elevated “list-to-lease” time reflects persistent softness in multifamily trends nationwide.
Regional Shifts—Sun Belt Down, Select Markets Up
Rent declines are concentrated in Sun Belt metros. Austin led the drop, with rents falling 5.9% over the past year. A surge of new supply pushed prices lower across the market.
Meanwhile, Virginia Beach posted the strongest rent growth in the country at 5.3%. Tech job gains also lifted rents in San Francisco and San Jose. Hiring momentum supported pricing in those coastal markets. Midwest metros, however, remain relatively resilient. Affordable rents and steady demand continue to support performance.
What’s Next
Multifamily conditions are expected to stay soft through 2026 as the industry continues to absorb high vacancy and elevated supply. Whether multifamily trends shift toward tighter market conditions will depend largely on the pace of rental demand—a factor clouded by broader labor market uncertainty.